10-K: Annual report [Section 13 and 15(d), not S-K Item 405]
Published on February 27, 2025
UNITED STATES
SECURITIES AND EXCHANGE COMMISSION
Washington, D.C. 20549
FORM
For the fiscal year ended
Commission File Number:
(Exact name of registrant as specified in its charter)
|
||
(State or Other Jurisdiction of |
|
(I.R.S. Employer |
|
|
|
|
(Address of Principal Executive Offices) |
|
(Zip Code) |
(Registrant’s telephone number, including area code)
Securities registered pursuant to Section 12(b) of the Act:
Title of each class |
|
Trading Symbol(s) |
|
Name of each exchange on which registered |
|
|
Securities registered pursuant to Section 12(g) of the Act: None
Indicate by check mark if the registrant is a well-known seasoned issuer, as defined in Rule 405 of the Securities Act. Yes ☐
Indicate by check mark if the registrant is not required to file reports pursuant to Section 13 or Section 15(d) of the Act. Yes ☐
Indicate by check mark whether the registrant (1) has filed all reports required to be filed by Section 13 or 15(d) of the Securities Exchange Act of 1934 during the past 12 months (or for such shorter period that the registrant was required to file such reports), and (2) has been subject to such filing requirements for the past 90 days.
Indicate by check mark whether the registrant has submitted electronically every Interactive Data File required to be submitted pursuant to Rule 405 of Regulation S-T (§ 232.405 of this chapter) during the preceding 12 months (or for such shorter period that the registrant was required to submit such files).
Indicate by check mark whether the registrant is a large accelerated filer, an accelerated filer, a non-accelerated filer, a smaller reporting company or an emerging growth company. See the definitions of “large accelerated filer”, “accelerated filer”, “smaller reporting company” and “emerging growth company” in Rule 12b-2 of the Exchange Act.
Large accelerated filer |
☐ |
☒ |
|
Non-accelerated filer |
☐ |
Smaller reporting company |
|
Emerging growth company |
|
||
If an emerging growth company, indicate by check mark if the registrant has elected not to use the extended transition period for complying with any new or revised financial accounting standards provided pursuant to Section 13(a) of the Exchange Act.
Indicate by check mark whether the registrant has filed a report on and attestation to its management’s assessment of the effectiveness of its internal control over financial reporting under Section 404(b) of the Sarbanes-Oxley Act (15 U.S.C. 7262(b)) by the registered public accounting firm that prepared or issued its audit report.
If securities are registered pursuant to Section 12(b) of the Act, indicate by check mark whether the financial statements of the registrant included in the filing reflect the correction of an error to previously issued financial statements.
Indicate by check mark whether any of those error corrections are restatements that required a recovery analysis of incentive-based compensation received by any of the registrant’s executive officers during the relevant recovery period pursuant to §240.10D-1(b). ☐
Indicate by check mark whether the registrant is a shell company (as defined in Rule 12b-2 of the Exchange Act). Yes ☐ No
The aggregate market value of the common stock held by non-affiliates of the registrant as of June 30, 2024, based on the closing price on that date of $
Documents Incorporated by Reference
TABLE OF CONTENTS
|
|
|
Page |
|
|
|
|
|
|
|
|
Item 1. |
|
1 |
|
Item 1A. |
|
24 |
|
Item 1B. |
|
43 |
|
Item 1C. |
|
43 |
|
Item 2. |
|
44 |
|
Item 3. |
|
44 |
|
Item 4. |
|
44 |
|
|
|
|
|
|
|
|
|
|
|
|
|
Item 5. |
|
45 |
|
Item 6. |
|
48 |
|
Item 7. |
Management’s Discussion and Analysis of Financial Condition and Results of Operations |
|
49 |
Item 7A. |
|
61 |
|
Item 8. |
|
F-1 |
|
Item 9. |
Changes in and Disagreements With Accountants on Accounting and Financial Disclosure |
|
56 |
Item 9A. |
|
56 |
|
Item 9B. |
|
57 |
|
Item 9C. |
Disclosure Regarding Foreign Jurisdictions that Prevent Inspections |
|
57 |
|
|
|
|
|
|
|
|
|
|
|
|
Item 10. |
|
58 |
|
Item 11. |
|
61 |
|
Item 12. |
Security Ownership of Certain Beneficial Owners and Management and Related Stockholder Matters |
|
62 |
Item 13. |
Certain Relationships and Related Transactions, and Director Independence |
|
63 |
Item 14. |
|
65 |
|
|
|
|
|
|
|
|
|
|
|
|
|
Item 15. |
|
66 |
|
Item 16. |
|
67 |
|
|
68 |
||
i
PART I
Unless indicated otherwise in this Annual Report on Form 10-K or the context requires otherwise, the terms:
Item 1. Business
Overview
We are a financial services company that primarily lends to and invests in corporate debt securities of companies, including small to large private U.S. companies. We were organized as a Maryland corporation on August 26, 2019 and are structured as an externally managed, non-diversified closed-end management investment company. We have elected to be regulated as a business development company (“BDC”) under the Investment Company Act of 1940, as amended (the “1940 Act”). Beginning with our taxable year ended December 31, 2020, we have elected to be treated as a regulated investment company (a “RIC”) under Subchapter M of the Internal Revenue Code of 1986, as amended (the “Code”), and we expect to qualify as a RIC annually.
On January 22, 2024, we completed our initial public offering (the “IPO”) issuing 5,450,000 shares of common stock, par value $0.001, at a public offering price of $16.45 per share. Our common stock began trading on the New York Stock Exchange under the symbol “PSBD” on January 18, 2024.
We are externally managed by the Investment Advisor, an investment adviser that is registered with the Securities and Exchange Commission (“SEC”) under the Investment Advisers Act of 1940 (the “Advisers Act”), pursuant to an amended and restated investment advisory agreement between us and the Investment Advisor (the “Advisory Agreement”). Subject to the supervision of our Board of Directors (the “Board”), a majority of which is made up of directors that are not “interested persons” as defined in Section 2(a)(19) of the 1940 Act (the “Independent Directors”), our Investment Advisor manages our day-to-day operations and provides us with investment advisory and management services and certain administrative services. The Investment Advisor, in its capacity as Administrator, provides the administrative services necessary for us to operate pursuant to an administration agreement between us and the Administrator (the “Administration Agreement”). Our Investment Advisor is a majority-owned subsidiary of PSCM, which is a privately-held firm specializing in global alternative (non-traditional) investments with a total return orientation.
Our investment objective is to maximize total return, comprised of current income and capital appreciation. Our current investment focus is guided by two strategies that facilitate our investment opportunities and core competencies: (1) investing in corporate debt securities and, to a lesser extent, (2) investing in collateralized loan obligation (“CLO”) structured credit funds that typically own corporate debt securities, including the equity and junior debt tranches of CLOs. To a limited extent, we may enter into derivatives transactions, which may utilize instruments such as forward contracts, currency options and interest rate swaps, caps, collars and floors to seek to hedge against fluctuations in the relative values of our portfolio positions from changes in currency exchange rates and market interest rates or to earn income and enhance our total returns. We may also receive warrants or other rights to acquire equity or similar securities or otherwise purchase such securities in connection with making a debt investment in a company. We will continue to evaluate other investment strategies in the ordinary course of business with no specific top-down allocation to any single investment strategy.
The Company has four wholly-owned subsidiaries: Palmer Square BDC Funding I LLC (“PS BDC Funding”), a special purpose wholly-owned subsidiary established for utilizing the Company’s revolving credit facility with Bank of America, N.A. (“BofA N.A.”); Palmer Square BDC Funding II LLC (“PS BDC Funding II”), a special purpose wholly-owned subsidiary established for utilizing the Company’s credit facility with Wells Fargo Bank, National Association (“WFB”); Palmer Square BDC CLO 1, Ltd., a special purpose wholly-owned subsidiary established to be the Issuer in connection with the CLO Transaction (as defined below); and Palmer Square BDC CLO 1, LLC a special purpose indirect wholly-owned subsidiary established to be the Co-Issuer in connection with the CLO Transaction. These subsidiaries are consolidated in the financial statements of the Company. We “look through” such subsidiaries to determine our compliance with the provisions of the 1940 Act, including provisions governing capital structure and leverage, and such subsidiaries comply with such provisions on an aggregate basis with us (Section 18 of the 1940 Act).
Our Portfolio
As of December 31, 2024, we had 262 debt and equity investments in 207 portfolio companies and we had total assets of approximately $1.4 billion.
1
Listed below are our top ten portfolio companies and industries (excluding short-term investments) represented as a percentage of total assets as of December 31, 2024:
Portfolio Company |
|
2024 |
|
|
Nexus Buyer LLC |
|
|
1.0 |
% |
Lightstone Holdco LLC |
|
|
1.0 |
% |
Delta Topco, Inc. |
|
|
1.0 |
% |
Project Boost Purchaser, LLC |
|
|
0.9 |
% |
Gainwell Acquisition Corp. |
|
|
0.9 |
% |
OneDigital Borrower LLC |
|
|
0.9 |
% |
Nielsen Consumer Inc. |
|
|
0.9 |
% |
Barracuda Networks, Inc. |
|
|
0.9 |
% |
Flash Charm, Inc. |
|
|
0.9 |
% |
US Radiology Specialists, Inc. |
|
|
0.9 |
% |
Industry |
|
2024 |
|
|
Software |
|
|
10.0 |
% |
Healthcare Providers and Services |
|
|
9.2 |
% |
Professional Services |
|
|
7.5 |
% |
IT Services |
|
|
6.6 |
% |
Chemicals |
|
|
5.0 |
% |
Insurance |
|
|
4.9 |
% |
Construction and Engineering |
|
|
4.4 |
% |
Diversified Financial Services |
|
|
3.9 |
% |
Independent Power and Renewable Electricity Producers |
|
|
3.2 |
% |
Hotels, Restaurants and Leisure |
|
|
3.1 |
% |
Listed below are our top ten portfolio companies and industries (excluding short-term investments) represented as a percentage of total assets as of December 31, 2023:
Portfolio Company |
|
2023 |
|
|
Idera, Inc. |
|
|
1.3 |
% |
Aptean Inc |
|
|
1.2 |
% |
Vision Solutions, Inc. |
|
|
1.2 |
% |
Minotaur Acquisition, Inc. |
|
|
1.1 |
% |
Gainwell Acquisition Corp. |
|
|
1.0 |
% |
Infinite Bidco, LLC |
|
|
1.0 |
% |
Acrisure, LLC |
|
|
1.0 |
% |
Delta Topco, Inc. |
|
|
0.9 |
% |
Barracuda Networks, Inc. |
|
|
0.9 |
% |
Ivanti Software, Inc. |
|
|
0.9 |
% |
Industry |
|
2023 |
|
|
Software |
|
|
13.9 |
% |
Healthcare Providers and Services |
|
|
9.2 |
% |
Professional Services |
|
|
7.1 |
% |
IT Services |
|
|
6.6 |
% |
Insurance |
|
|
5.8 |
% |
Diversified Financial Services |
|
|
4.2 |
% |
Hotels, Restaurants and Leisure |
|
|
4.1 |
% |
Media |
|
|
3.7 |
% |
Independent Power and Renewable Electricity Producers |
|
|
3.4 |
% |
Chemicals |
|
|
2.9 |
% |
The Investment Advisor
The Investment Advisor serves as our investment adviser pursuant to the Advisory Agreement and manages our day-to-day operations and provides us with investment advisory and management services and certain administrative services. The investment team (the “Investment Team”) of our Investment Advisor is responsible for identifying investment opportunities, conducting research and due diligence on prospective investments, structuring our investments and monitoring and servicing our investments. As of December 31, 2024, the Investment Team was comprised of 33 investment professionals, all of whom dedicate a substantial portion of their time to the Company. In addition, the team has 13 dedicated operations professionals. The Investment Advisor believes that it has experienced support personnel, including individuals with expertise in risk management, legal, accounting, tax, information technology and compliance, among others.
2
The Investment Team employs a blend of top-down and granular, bottom-up fundamental credit analysis. The senior members of the Investment Team have been actively involved in the alternative credit investing market for an average of 20 years and have built strong relationships with private equity sponsors, banks and financial intermediaries. The Investment Advisor has an investment committee (the “Investment Committee”) comprised of four members that is responsible for approving all of our investments and is responsible for the day-to-day management of the portfolio. See “Item 1. Business—Investment Committee” below for a discussion of the Investment Committee.
The Investment Advisor has entered into a Resource Sharing Agreement (the “Resource Sharing Agreement”) with PSCM, pursuant to which PSCM provides the Investment Advisor with access to the resources of PSCM, including the Investment Team, so as to enable the Investment Advisor to fulfill its obligations under the Advisory Agreement. Through the Resource Sharing Agreement, the Investment Advisor capitalizes on the significant deal origination, credit underwriting, due diligence, investment structuring, execution, portfolio management and monitoring experience of PSCM’s investment professionals.
Palmer Square Capital Management
PSCM is a Delaware limited liability company formed in 2009 and had approximately $33.2 billion in assets under management as of December 31, 2024 with approximately $4.8 billion in assets under management in opportunistic strategies (which includes the Company), approximately $3.5 billion in assets under management in income/short duration strategies and approximately $24.9 billion in assets under management in private credit/structured credit issuance strategies. PSCM and its affiliates, including the Investment Advisor, manage portfolios of both corporate credit and structured credit as well as diverse strategies designed with the intent to achieve high risk-adjusted returns over market cycles. We believe PSCM’s experience in analyzing companies and investment structures provides a sustainable competitive advantage over other firms. PSCM is 100% management owned and is led by Christopher D. Long and Angie K. Long. The firm is an SEC registered investment adviser.
Investment Advisory Agreement
Subject to the overall supervision of our Board and in accordance with the 1940 Act, the Investment Advisor manages our day-to-day operations and provides investment advisory services to us. Under the terms of the Advisory Agreement, our Investment Advisor:
Pursuant to the Advisory Agreement, we pay the Investment Advisor a fee for its investment advisory and management services consisting of two components—a base management fee and, subsequent to the IPO, an incentive fee (the “Income Incentive Fee”). The cost of both the base management fee and, subsequent to the IPO, the Income Incentive Fee, is ultimately borne by our stockholders.
Base Management Fee
In return for providing management services to the Company, the Company pays the Investment Advisor a base management fee. Upon completion of the IPO, the base management fee is calculated and paid quarterly at an annual rate of 1.75% of the average value of the weighted average (based on the number of shares outstanding each day in the quarter) of the Company’s total net assets at the end of the two most recently completed calendar quarters. The base management fee for any partial quarter will be pro-rated based on the number of days actually elapsed in that quarter relative to the total number of days in such quarter.
Prior to the IPO, the base management fee was 2.00% of the average value of the weighted average (based on the number of shares outstanding each day in the quarter) of the Company’s total net assets at the end of the two most recently completed calendar quarters. The Investment Advisor, however, during any period prior to the IPO, agreed to waive its right to receive management fees in excess of an annual rate of 1.75% of the average value of the weighted average total net assets at the end of each of the Company’s two most recently completed calendar quarters. The Investment Advisor will not be permitted to recoup any base management fees waived for any period of time prior to the IPO.
3
Incentive Fee
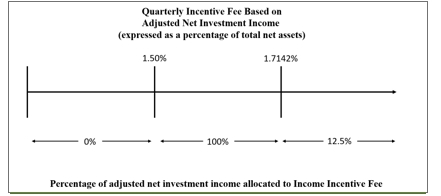
Pursuant to the Advisory Agreement, the Investment Advisor is not entitled to an incentive fee prior to the IPO because the Advisory Agreement provides that no incentive fee is payable prior to the IPO. Effective upon completion of the IPO, the Investment Advisor is entitled to the Income Incentive Fee based on the Company’s pre-incentive fee net investment income for the then most recently completed calendar quarter, as adjusted downward (but not upward) if over the most recently completed and eleven preceding calendar quarters since the IPO (or if shorter, the number of calendar quarters since the IPO) (each such period is referred to herein as the “Trailing Twelve Quarters”) aggregate net realized losses on the Company’s investments exceed the Company’s aggregate net investment income over the same period, excluding the most recently completed quarter, as described in more detail below. In this regard, if the Company’s net realized losses over the Trailing Twelve Quarters since the IPO (or if shorter, the number of calendar quarters since the IPO) are greater than the Company’s net investment income over the same period, excluding the most recently completed quarter, then the pre-incentive fee net income used in the calculation of the Income Incentive Fee would be subject to a downward adjustment. The amount of the adjustment would be equal to the amount by which such net realized losses exceed such net investment income. On the other hand, if the Company’s net investment income over the Trailing Twelve Quarters since the IPO (or if shorter, the number of calendar quarters since the IPO) is equal to or greater than the Company’s net realized losses over the same period, excluding the most recently completed quarter, then no adjustment to pre-incentive fee net investment income would be made. The Income Incentive Fee will be calculated and payable quarterly in arrears commencing with the first calendar quarter following the IPO. The Company will pay the Investment Advisor an Income Incentive Fee with respect to its “adjusted net investment income” in each calendar quarter as follows:
“Adjusted net investment income” means the Company’s “pre-incentive fee net investment income” during the then most recently completed calendar quarter minus the difference, if positive, between (i) the Company’s “net realized losses” over the then Trailing Twelve Quarters (or if shorter, the number of calendar quarters that have occurred since the IPO) and (ii) the Company’s “net investment income” over the Trailing Twelve Quarters (excluding the then most recently completed calendar quarter). No adjustment (downward or upward) will be made to “pre-incentive fee net investment income” if the difference between clause (i) minus clause (ii) is zero or negative.
“Pre-incentive fee net investment income” means interest income, dividend income and any other income (including any other fees such as commitment, origination, structuring, diligence and consulting fees or other fees that the Company receives from portfolio companies but excluding fees for providing managerial assistance) accrued during the calendar quarter, minus operating expenses for the quarter (including the base management fee, any expenses payable under the Administration Agreement, and any interest expense and dividends paid on any outstanding preferred stock, but excluding the Income Incentive Fee). “Pre-incentive fee net investment income” includes, in the case of investments with a deferred interest feature such as market discount, original issue discount (“OID”), debt instruments with payment-in-kind (“PIK”) interest, preferred stock with PIK dividends and zero-coupon securities, accrued income that the Company has not yet received in cash.
“Net realized losses” in respect of a particular period means the difference, if positive, between (i) the aggregate realized capital losses on the Company’s investments in such period and (ii) the aggregate realized capital gains on the Company’s investments in such period. As noted above, “net realized losses” will not by itself cause an upward adjustment to adjusted net investment income. “Net investment income” in respect of the particular period means interest income, dividend income and any other income (including any other fees such as commitment, origination, structuring, diligence and consulting fees or other fees that the Company receives from portfolio companies but excluding fees for providing managerial assistance) accrued during the particular period, minus operating expenses for the particular period (including the base management fee, the Income Incentive Fee, any expenses payable under the Administration Agreement, and any interest expense and dividends paid on any outstanding preferred stock). “Net investment income” includes, in the case of investments with a deferred interest feature such as market discount, OID, debt instruments with PIK interest, preferred stock with PIK dividends and zero-coupon securities, accrued income that the Company has not yet received in cash.
The Income Incentive Fee amount, or the calculations pertaining thereto, as appropriate, will be pro-rated for any period less than a full calendar quarter.
Effective upon completion of the IPO, the Investment Advisor has also agreed to use the most recently completed and three preceding calendar quarters (each such period is referred to herein as the “Trailing Four Quarters”) in addition to the Trailing Twelve Quarters to compute the incentive fee payable to it by the Company. In conjunction therewith, the Investment Advisor has agreed to calculate the incentive fee based on the Trailing Twelve Quarters and the Trailing Four Quarters and in the event that any Trailing Four Quarter period calculation produces a lower incentive fee as compared to the applicable Trailing Twelve Quarter period calculation for any quarterly period, then the Trailing Four Quarter Period will be used in connection with the calculation of the incentive fee payable to the Investment Advisor by the Company for such quarter.
4
The following is a graphical representation of the calculation of the Income Incentive Fee based on “adjusted net investment income” that is now in place subsequent to the IPO:
Example 1—Income Incentive Fee:
Assumptions
Alternative 1 - The Company is below the hurdle
Additional Assumptions
Adjusted net investment income does not exceed the hurdle rate, therefore there is no Income Incentive Fee.
Alternative 2 - The Company exceeds the hurdle
Additional Assumptions
Adjusted net investment income exceeds hurdle rate, therefore there is an Income Incentive Fee.
Income Incentive Fees
= 100% × “Catch-Up” + the greater of 0% AND (12.5% × (adjusted net investment income — 1.7142%)
= (100% × (1.6625% - 1.5000%)) + 0%
= 100% × 0.1625%
= 0.1625%
5
Alternative 3 - The Company exceeds the catch-up
Additional Assumptions
Adjusted net investment income exceeds hurdle rate, therefore there is an Income Incentive Fee.
Income Incentive Fee
= 100% × “Catch-Up” + the greater of 0% AND (12.5% × (adjusted net investment income — 1.7142%)
= (100% × (1.7142% - 1.5000%)) + (12.5% × (2.0625% - 1.7142%))
= 0.2142% + (12.5% × 0.3483%)
= 0.2142% + 0.0435%
= 0.2577%
Alternative 4 - The Company does not exceed the hurdle due to net realized losses
Additional Assumptions
= 1.6625% - (9.00% - 8.00%)
= 1.6625% - 1.00%
= 0.6625%
Adjusted net investment income does not exceed the hurdle rate, therefore there is no Income Incentive Fee.
Payment of Our Expenses
All professionals of the Investment Advisor, when and to the extent engaged in providing investment advisory and management services to us, and the compensation and routine overhead expenses of personnel allocable to these services to us, are provided and paid for by the Investment Advisor and not by us. We bear all other out-of-pocket costs and expenses of our operations and transactions.
6
Duration and Termination
The Advisory Agreement was approved by the Board on November 13, 2019 for an initial two-year term. Unless terminated earlier as described below, the Advisory Agreement will remain in effect from year to year if approved annually by our Board or by the affirmative vote of the holders of a majority of our outstanding voting securities, and, in either case, if also approved by a majority of our Independent Directors. At a meeting held on March 10, 2022, our Board approved an amended and restated Advisory Agreement, to be effective upon completion of the IPO. Our Board most recently determined to re-approve the Advisory Agreement for an additional one-year term ending January 13, 2026 at a meeting held on November 1, 2024. The Advisory Agreement automatically terminates in the event of its assignment, as defined in the 1940 Act, by the Investment Advisor and may be terminated by either party without penalty upon not less than 60 days’ written notice to the other. The holders of a majority of our outstanding voting securities may also terminate the Advisory Agreement without penalty upon 60 days’ written notice.
The Advisory Agreement provides that, absent criminal conduct, willful misfeasance, bad faith or gross negligence in the performance of its duties or by reason of the reckless disregard of its duties and obligations under the Advisory Agreement, the Investment Advisor and its professionals and any other person or entity affiliated with it are entitled to indemnification from us for any damages, liabilities, costs and expenses (including reasonable attorneys’ fees and amounts reasonably paid in settlement) arising from the rendering of our Investment Advisor’s services under the Advisory Agreement or otherwise as our investment adviser.
Administration Agreement
The Investment Advisor, in its capacity as Administrator, provides the administrative services necessary for us to operate pursuant to an administration agreement between us and the Administrator (the “Administration Agreement”). Pursuant to the Administration Agreement, the Administrator furnishes office facilities and equipment and provides clerical, bookkeeping, compliance, recordkeeping and other administrative services at such facilities. Under the Administration Agreement, the Administrator performs, or oversees the performance of, required administrative services, which include being responsible for the financial and other records that the Company is required to maintain and preparing reports to stockholders and reports and other materials filed with the SEC. In addition, the Administrator assists the Company in determining and publishing the Company’s net asset value, overseeing the preparation and filing of tax returns and the printing and dissemination of reports and other materials to stockholders, and generally overseeing the payment of expenses and the performance of administrative and professional services rendered to the Company by others. Under the Administration Agreement, the Administrator also provides managerial assistance on the Company’s behalf to those portfolio companies that have accepted the offer to provide such assistance.
Under the Administration Agreement, the Company reimburses the Administrator based upon its allocable portion of the Administrator’s overhead (including rent) in performing its obligations under the Administration Agreement, including rent, the fees and expenses associated with performing compliance functions and the Company’s allocable portion of the cost of its officers (including the Company’s Chief Financial Officer and Chief Compliance Officer), and any of their respective staff who provide services to the Company, operations staff who provide services to the Company, and internal audit staff, if any, to the extent internal audit performs a role in the Company’s Sarbanes-Oxley internal control assessment. In addition, if requested to provide managerial assistance to portfolio companies, the Administrator is reimbursed based on the services provided. The Administration Agreement has an initial term of two years and may be renewed with the approval of the Board. Our Board most recently determined to re-approve the Administration Agreement for an additional one-year term ending January 13, 2026 at a meeting held on November 1, 2024. The Administration Agreement may be terminated by either party without penalty upon 60 days’ written notice to the other party. To the extent that the Administrator outsources any of its functions, the Company pays the fees associated with such functions on a direct basis without any incremental profit to the Administrator.
In addition, the Administrator has also entered into an agreement (the “Sub-Administration Agreement”) to delegate certain administrative functions to U.S. Bancorp Fund Services, LLC (the “Sub-Administrator”). The Company has also engaged Equiniti Trust Company, LLC or its affiliates (“Equiniti”) directly to serve as transfer agent, registrar and dividend disbursing agent and engaged U.S. Bank or its affiliates directly to serve as custodian. Prior to the Company’s engagement of Equiniti upon the closing of the IPO, U.S. Bank served as the Company’s transfer agent, distribution paying agent and registrar.
Market Opportunity
The Investment Team believes that existing market conditions, including those set forth below, have combined to create an attractive investment environment for us:
Large Addressable Market Opportunity. Macro volatility resulting from geopolitical tensions, inflationary pressures and rising interest rates has led to increased opportunities in the secondary loan market, in addition to presenting higher yielding opportunities in the private credit markets. As of the date of this report, we believe the pipeline for the primary loan market is building as debt capital markets have become more active in the past few months. In addition, we also believe demand for floating rate loans has remained strong due to the meaningful increase in yields.
Risk Adjusted Returns. Broadly-syndicated fixed and floating rate loans and corporate debt provides an opportunity set that the Investment Team believes offers an attractive, risk-adjusted return, including through NAV growth from current portfolio market price improvement and total return opportunities for broadly syndicated loans. Specifically, the Investment Team believes it can mitigate risk and achieve our investment objective by: (i) seeking the best relative value, which may equate to buying new loans or other corporate debt issuances at a discount or purchasing in the secondary market, and (ii) seeking to buy loans or other corporate debt issuances that the Investment Team believes have strong fundamentals and low default risk and are capable of withstanding significant downward pricing pressure.
Expansion of Corporate Debt Market. The corporate debt market segment on which the Investment Team focuses is industry diverse and large, and includes small to large U.S. companies. In addition, we believe that private equity sponsors have a large pool of uninvested private equity capital. The Investment Team believes private equity firms are poised to deploy meaningful amounts of capital, thus creating ongoing investment opportunities for private lenders such as us.
7
Regulatory Environment and Opportunity for Alternative Lenders. Traditional banks have reduced their lending activities to smaller private companies in recent years and bank stakeholders, including shareholders, lenders and regulators, continue to exert pressure to contain the amount of these types of assets held on bank balance sheets. Examples of this include continued investor focus on the amount of assets whose fair value cannot be determined by using observable measures, or “Level 3 assets,” held on bank balance sheets. As a result of decreased lending by banks to smaller private companies, the Investment Team believes there are increased opportunities for alternative lenders such as us.
CLO Equity and Debt. The Investment Team believes that CLO equity and debt has been a tremendous source of returns for investors historically and has the potential to offer investors high cash on cash returns with low credit risk and low correlation to traditional assets classes. Because CLO securities are floating rate instruments designed to mitigate interest rate sensitivity, investors may not directly suffer the same adverse effects that other asset classes may experience due to rising interest rates. The Investment Team has a strong track record of investing in CLO equity and debt, and believes CLO investments continue to offer attractive relative value.
Financing Arrangements
Bank of America Credit Facility
On February 18, 2020, the Company, through a special purpose wholly-owned subsidiary, PS BDC Funding (together with the Company, the “Borrowers”) entered into a Credit Agreement (the “Credit Agreement”) with certain financial institutions as lenders (“Lenders”), BofA, N.A. as the administrative agent and BofA Securities, Inc. (“BofA Securities”), as Lead Arranger and Sole Book Manager, pursuant to which the Lenders agreed to provide the Company with a revolving line of credit (the “BoA Credit Facility”).
Under the BoA Credit Facility, the Lenders have agreed to extend credit to PS BDC Funding in an aggregate amount up to the Commitment (as defined in the Credit Agreement) amount. The Commitment amount for the BoA Credit Facility is currently $525 million. The Borrowers’ ability to draw under the BoA Credit Facility is scheduled to terminate on February 11, 2028. All amounts outstanding under the BoA Credit Facility are required to be repaid by February 18, 2028. On March 29, 2024, we entered into a fourth amendment to the BoA Credit Facility to, among other things: (i) extend the facility maturity date from February 18, 2025 to February 18, 2028; (ii) update arrangements for the calculation of the fee on unused commitments from 1.30% to a range from 0.50% to 1.40%, depending on the amount of commitments utilized, and (iii) payment of an extension fee.
Prior to February 3, 2023, the loans under the BOA Credit Facility may have been base rate loans or euro currency loans. The base rate loans bore interest at the base rate plus 1.30%, and the eurocurrency rate loans bore interest at 1-month or 3-month LIBOR plus 1.30%. The “base rate” was equal to the highest of (a) the federal funds rate plus 0.50%, (b) the prime rate, and (c) 1-month or 3-month LIBOR. On February 3, 2023, the Company entered into an omnibus amendment to the BoA Credit Facility that, among other things: (i) removed LIBOR transition language and (ii) replaced eurocurrency rate loans with SOFR loans.
As of February 3, 2023, the loans under the BoA Credit Facility may be base rate loans or SOFR loans. The base rate loans will bear interest at the base rate plus 1.40%, and the SOFR loans will bear interest at 1-month SOFR plus 1.40% or 3-month SOFR plus 1.45%. The “base rate” will be equal to the highest of (a) the federal funds rate plus 0.50%, (b) the prime rate, and (c) 1-month or 3-month SOFR plus 0.10%. The Credit Agreement includes fallback language in the event that SOFR becomes unavailable. Interest pursuant to base rate loans is payable quarterly in arrears, and interest pursuant to SOFR loans is payable either quarterly or monthly, as specified by the Borrowers in a loan notice pertaining thereto. The Credit Agreement requires the payment of a commitment fee of 0.50% for unused Commitments until the four-month anniversary of the Second Amendment to the Credit Agreement. Thereafter, the commitment fee is 0.50% on unused Commitments up to 30% of the BoA Credit Facility, and 1.30% on unused Commitments in excess of 30% of the BoA Credit Facility. Such fee is payable quarterly in arrears. The advance rate for PS BDC Funding’s Eligible Collateral Assets ranges from 40% for Second Lien Bank Loans to 70% for First Lien Bank Loans that are B Assets to 100% for Cash (excluding Excluded Amounts) (as each such term is defined in the Credit Agreement).
PS BDC Funding has pledged all of its assets to BofA N.A., in its capacity as Administrative Agent, to secure its obligations under the BoA Credit Facility. Both the Company and PS BDC Funding have made customary representations and warranties and are required to comply with various covenants, reporting requirements, and other customary requirements for similar credit facilities. Borrowing under the BoA Credit Facility is subject to the leverage restrictions contained in the 1940 Act and PS BDC Funding complies with 1940 Act provisions relating to affiliated transactions and custody (Section 17, as modified by Section 57, of the 1940 Act). The custodian of the assets pledged to BofA N.A. pursuant to the BoA Credit Facility is U.S. Bank. The obligations under the Credit Agreement may be accelerated upon the occurrence of an event of default under the Credit Agreement, including in the event of a change of control of PS BDC Funding or if the Investment Advisor ceases to serve as investment adviser to the Company.
As of December 31, 2024, we had approximately $352.3 million principal outstanding and $172.7 million of available Commitments under the BoA Credit Facility, and PS BDC Funding was in compliance with the applicable covenants in the BoA Credit Facility on such date.
Wells Fargo Credit Facility
On December 18, 2020, the Company, through a special purpose wholly-owned subsidiary, PS BDC Funding II (together with the Company, the “WF Borrowers”) entered into a Loan and Security Agreement (the “Loan Agreement”) with certain financial institutions as lenders (“WF Lenders”), WFB, as the administrative agent and U.S. Bank National Association (“U.S. Bank”), as Collateral Agent and Custodian, pursuant to which the WF Lenders agreed to provide the Company with a line of credit (the “WF Credit Facility”).
On December 18, 2023, the Company entered into an amendment to the WF Credit Facility (the “WF Credit Facility Fourth Amendment”) that amends the WF Credit Facility to, among other things: (i) increase the amount available for borrowing under the WF Credit Facility from $150,000,000 to $175,000,000, (ii) extend the facility maturity date from December 18, 2025 to December 18, 2028 and (iii) extend the reinvestment period from December 18, 2023 to December 18, 2026 (subject to other provisions of the WF Credit Facility).
8
Prior to April 10, 2023, the loans under the WF Credit Facility may have been Broadly Syndicated Loans or Middle Market loans and were eurocurrency rate loans unless such rate was unavailable, in which case the loans were base rate loans until such rate was available. Broadly Syndicated Loans bore interest at the LIBOR or base rate, as applicable, plus 1.85%, and Middle Market Loans bore interest at LIBOR or base rate, as applicable, plus 2.35%. The “base rate” was equal to the highest of (a) the federal funds rate plus 0.50% and (b) the prime rate. On April 10, 2023, the Company entered into an amendment to the WF Credit Facility that, among other things: (i) transferred and assigned U.S. Bank National Association’s rights and obligations as collateral agent and as a secured party to U.S. Bank Trust Company, National Association, (ii) referenced SOFR instead of LIBOR and (iii) removed LIBOR transition language.
As of April 10, 2023, the loans under the WF Credit Facility may be Broadly Syndicated Loans or Middle Market Loans and will bear interest at Daily Simple SOFR or base rate (to the extent Daily Simple SOFR is unavailable), plus 2.50%, with an interest rate floor of 0.0%. The “base rate” will be equal to the highest of (a) the federal funds rate plus 0.50% and (b) the prime rate. The Loan Agreement includes fallback language in the event that Daily Simple SOFR becomes unavailable. Interest is payable quarterly, as determined by the WFB as the administrative agent. Following an amendment to the WF Credit Facility on October 13, 2021, the Loan Agreement requires the payment of a non-usage fee of (x) during the first thirteen months following the closing of the WF Credit Facility, 0.50% multiplied by daily unused Facility Amounts, (y) between thirteen and sixteen months following the closing of the WF Credit Facility, 0.50% multiplied by the lesser of (1) daily unused Facility Amounts and (2) 50% of the Facility Amount plus 2.00% multiplied by the greater of (i) the difference between the daily unused Facility Amount and 50% of the Facility Amount and (ii) zero, and, (z) thereafter, 0.50% multiplied by the lesser of (1) daily unused Facility Amounts and (2) 20% of the Facility Amount plus 2.00% multiplied by the greater of (i) the difference between the daily unused Facility Amount and 20% of the Facility Amount and (ii) zero. Such fee is payable quarterly in arrears. The WF Credit Facility includes the option to downsize the facility by paying a Commitment Reduction Fee. The Fee is equal to 2.00% of the facility reduction amount prior to the one-year anniversary of the WF Credit Facility Fourth Amendment, and 1.00% thereafter. The applicable percentage for the advance rate on PS BDC Funding II’s Eligible Loans ranges from 67.5% for Middle Market Loans to 70% for Broadly Syndicated Loans (as each such term is defined in the Loan Agreement).
PS BDC Funding II has pledged all of its assets to U.S. Bank, in its capacity as Collateral Agent, to secure its obligations under the WF Credit Facility and U.S. Bank acts as the custodian of such assets. Both the Company and PS BDC Funding II have made customary representations and warranties and are required to comply with various covenants, reporting requirements, and other customary requirements for similar credit facilities. Borrowing under the WF Credit Facility is subject to the leverage restrictions contained in the 1940 Act and PS BDC Funding II complies with 1940 Act provisions relating to affiliated transactions and custody (Section 17, as modified by Section 57, of the 1940 Act). The obligations under the Loan Agreement may be accelerated upon the occurrence of an event of default under the Loan Agreement, including in the event of a change of control of PS BDC Funding II, if the Investment Advisor ceases to serve as investment adviser to the Company, or if PSCM or its affiliates cease to directly or indirectly own a majority of the membership interests of the Investment Advisor.
As of December 31, 2024, we had $150.8 million principal outstanding and $24.2 million of available Commitments under the WF Credit Facility, and PS BDC Funding II was in compliance with the applicable covenants in the WF Credit Facility on such date.
CLO Transaction
On May 23, 2024, we completed a $400.5 million term debt securitization (the “CLO Transaction”), also known as a collateralized loan obligation (“CLO”), in connection with which our wholly-owned indirect subsidiary issued the Notes (as defined below). The CLO Transaction functions as a source of long-term balance sheet financing for a portion of our portfolio investments and, as a result, the Notes issued in connection with the CLO Transaction are subject to our regulatory asset coverage requirements.
The notes offered in the CLO Transaction were issued by Palmer Square BDC CLO 1, Ltd. (the “Issuer”), an exempted company incorporated with limited liability under the laws of the Cayman Islands and our wholly-owned subsidiary, and consist of (i) $232 million of Class A Notes (the “Class A Notes”); (ii) $58 million of Class B-1 Notes, (the “Class B-1 Notes”); and (iii) $10 million of Class B-2 Notes (the “Class B-2 Notes” and, together with the Class A Notes and the Class B-1 Notes, the “Secured Notes”). Additionally, the Issuer issued $100.5 million of Subordinated Notes (the “Subordinated Notes”), which do not bear interest but are entitled to all of the principal and interest payments made on the loan portfolio held by the Issuer, net of interest and principal payments distributed to the holders of the Secured Notes. The Secured Notes together with the Subordinated Notes are collectively referred to herein as the “Notes.”
The CLO Transaction is backed by a diversified portfolio of senior secured loans or participation interests therein with the potential for investment in second lien loans or participation interests therein, corporate bonds or loans made to a debtor-in-possession pursuant to Section 364 of the Bankruptcy Code having the priority allowed by either Section 364(c) or 364(d) of the Bankruptcy Code and fully secured by senior liens or participation interests therein, which is managed by us as collateral manager pursuant to a collateral management agreement entered into with the Issuer (the “Collateral Management Agreement”). We have agreed to irrevocably waive all collateral management fees payable to us so long as we are the collateral manager under the Collateral Management Agreement. The Notes are scheduled to mature on July 15, 2037; however, the Notes may be redeemed by the Issuer, at the written direction of (i) a majority of the Subordinated Notes (with the consent of us, in the case of the Secured Notes) or (ii) us, in each case, on any business day on or after July 15, 2026.
As of December 31, 2024, we had outstanding indebtedness under the CLO Transaction of $300.0 million
9
Investment Criteria for Evaluating Investment Opportunities
The Company’s investment objective is to maximize total return, comprised of current income and capital appreciation. However, no assurance can be given that the Company’s investment objective will be achieved, and investment results may vary substantially on a monthly, quarterly and annual basis. The Investment Advisor seeks to achieve the Company’s investment objective by primarily investing in first and second lien secured loans of small to large private U.S. companies, and to a lesser extent CLO structured credit funds that typically own senior secured bank loans of public and private companies. The Company seeks to invest in credit and other assets that the Investment Advisor believes have strong structural protections, limited downside, and low long-term beta, or volatility, in comparison to systemic risk within the broader credit and equity markets. First and second lien secured loans generally are senior debt instruments that rank ahead of unsecured debt of a given portfolio company. These loans also have the benefit of security interests on the assets of the portfolio company, which may rank ahead of or be junior to other security interests. A significant portion of the loans in which the Company may invest or obtain exposure to through its investments in structured securities may be deemed “Covenant-Lite Loans,” which means the loans contain fewer or no maintenance covenants than other loans and do not include terms which allow the lender to monitor the performance of the borrower and declare a default if certain criteria are breached. See “Item 1A. Risk Factors—Risks Related to our Investments—Covenant-Lite Loans” below.
We seek to maximize returns and minimize risk for our investors by applying detailed, fundamental credit analysis to make and monitor our portfolio investments. While the structure of our investments may vary, the Company can invest in senior secured debt, senior unsecured debt, subordinated secured debt, subordinated unsecured debt, convertible debt, convertible preferred equity, preferred equity, common equity, warrants and other instruments, many of which generate current yield. Structurally, CLOs are entities that are formed to hold a portfolio of senior secured loans made to companies whose debt is generally rated below investment grade or, in limited circumstances, unrated. The senior secured loans within a CLO are limited to senior secured loans which meet specified credit and diversity criteria and are subject to concentration limitations in order to create an investment portfolio that is diverse by senior secured loan, borrower, and industry, with limitations on the number of non-U.S. borrowers. As of the date of this report, the Investment Advisor believes that the Company’s investment strategies are positioned to continue to benefit investors for the following three reasons: attractive yields, with a bias for high quality, short duration and liquid credits; the ability to rotate investments to take advantage of dislocations as they arise; and balance fundamentals and default risk with valuation.
In addition, to a lesser extent, portfolio investments may also include, but are not limited to, corporate structured credit, cash and synthetic CLOs, including the equity and junior debt tranches of CLOs, collateralized debt obligations (each, a “CDO”), swaps, asset backed securities, corporate bonds of large U.S. and non-U.S. companies, corporate bank loans, preferred stock, municipal bonds or loans and convertible securities.
While not our primary investment objective, our investments may include other equity investments, such as warrants, options to buy a minority interest in a portfolio company, or contractual payment rights or rights to receive a proportional interest in the operating cash flow or net income of such company. When determined by the Investment Advisor to be in our best interest, we may acquire a controlling interest in a portfolio company. We do not intend to create or acquire primary control of any entity which engages in investment activities in securities or other assets other than entities wholly owned by the Company. Any warrants we receive with our debt securities may require only a nominal cost to exercise, and thus, as a portfolio company appreciates in value, we may achieve additional investment return from this equity interest.
Our Investment Advisor may sell all or a portion of a position of the Company’s portfolio holdings when, in its opinion, one or more of the following occurs, among other reasons: (1) the deterioration of an issuer’s fundamentals; (2) changes in business strategy or key personnel; (3) rating agency downgrades or a decline in credit quality metrics; or (4) the Investment Advisor finds more attractive investment opportunities for the Company.
The Investment Advisor has the ability to invest in both illiquid and less liquid securities. The Investment Advisor may employ leverage, including through borrowing funds or issuing senior securities, and use derivatives, both for hedging purposes and to earn income and enhance total returns. The Investment Advisor may employ techniques to hedge investment risk, including without limitation, the use of forward contracts, currency options and interest rate swaps, caps, collars and floors. The Investment Advisor may use derivatives to earn income and enhance total returns by investing in derivatives securities and monitoring such investments to ensure that each holding is maintaining its investment potential.
Investment Approach
We seek to achieve our investment objective by applying rigorous credit analysis and asset-based and cash-flow based lending techniques to make and monitor our investments. We are routinely pursuing multiple investment opportunities, including primary purchases of newly issued securities and secondary purchases of securities on the open market.
The Investment Advisor employs a blend of top-down and granular, bottom-up fundamental credit analysis. The top-down approach has three components: (1) macro analysis whereby the Investment Team undertakes frequent dialogues among its team members regarding macro items including the economic outlook, financial and credit markets, new and secondary issues, regulatory changes, M&A environment, and valuation levels; (2) cross-asset relative value analysis which consists of the Investment Team analyzing various asset classes across the credit spectrum for strong relative value opportunities (e.g., analysis of valuation metrics across loans, bonds, convertibles, CLOs and mortgage credits to identify and monitor optimal risk / reward opportunities); and (3) active monitoring by the Investment Team of the major sectors within corporate credit, such as software and technology, healthcare and business services. With regard to the bottom-up analysis, the Investment Team undertakes frequent dialogue discussing key analyses including items such as determining an issuer’s ability to service debt, measuring past performance and understanding the approach of the management team and their ability to meet goals, deal structure model analysis, document analysis and other financial modeling and scenario testing. Finally, the bottom-up analysis includes trade specific analysis. For example, within the credit spectrum, the team also seeks to evaluate many trade specifics including liquidity, position size, upside/downside, and relative versus absolute value.
We believe our vast experience in analyzing and investing in corporate and structured credit provides us with a strong competitive advantage over other lenders with more limited experience investing in these markets. The Investment Advisor has deep expertise in evaluating, underwriting, monitoring and trading senior secured first lien, second lien term loans and other corporate debt securities. In addition, the Investment Advisor also has deep expertise in evaluating the investment merits and structural considerations of CLO debt and equity investments.
10
Our capital is generally used by our corporate borrowers to finance organic growth, acquisitions, recapitalizations and working capital. Our investment decisions are based on extensive analysis of potential portfolio companies’ business operations supported by an in-depth understanding of the quality of their recurring revenues and cash flow, variability of costs and the inherent value of their assets, including proprietary intangible assets and intellectual property. In making our CLO investments, we consider the indenture structure for that vehicle, its operating characteristics and compliance with its various indenture provisions, the collateral manager and its experience managing CLOs, as well as its corporate loan-based collateral pool.
The Investment Advisor believes it can mitigate risk by: (i) seeking the best relative value, which may equate to buying new loans and CLO debt and equity in the primary market at a discount or purchasing in the secondary market, and (ii) seeking to buy loans and CLO debt and equity that the Investment Advisor believes have strong fundamentals and low default risk capable of withstanding significant downward pricing pressure.
Investment Process – Senior Secured Loans
The Investment Team’s senior secured loan investment strategy has been consistent throughout multiple credit environments and is predicated on the view that a conservative approach to investing in first lien and second lien senior secured loans is the optimal strategy over the course of a credit cycle. Given the idiosyncratic nature of secured loans, our Investment Team focuses on downside protection and overall credit quality when evaluating each and every loan borrower.
The Investment Team evaluates many factors during the due diligence phase, including: company-specific risk, industry risk, balance sheet risk, cash flow generation, liquidity of the loan, in addition to other factors. The aggregate output of this information provides a building block for deeper financial analysis, including base-case financial projections, and more importantly, downside-case financial projections. Once the initial research process is completed, the Investment Team makes an informed decision on the quality of a particular loan and whether or not it meets our strict criteria for investment.
Corporate credit analysts at the Investment Advisor are each responsible for coverage of specific industries. Our Investment Advisor believes that in order to appropriately analyze and underwrite senior secured loans, each analyst has to be an expert in their respective industry verticals. As a result, the Investment Advisor’s corporate credit analysts average over 13 years of experience in broadly syndicated and small to large company credit. As it relates to the due diligence process, each analyst draws not only on their personal analytical skillset, but also utilize their networks within the industry. This can include calls and visits with existing company management teams, former industry CEOs, industry experts, private equity sponsors and industry investment bankers. The aggregate of this initial information gathering then lays the groundwork for fundamental financial analysis and detailed financial modeling, whereby the credit analyst constructs a base case and downside case set of projections.
At the conclusion of the due diligence process, the credit analyst presents a formal investment memorandum to the entire Investment Team, which includes the Investment Committee (which averages over 24 years of credit investing experience) and all industry credit analysts. Our Investment Advisor views this part of our process as unique across credit investment firms but believes that this more fulsome and collaborative process leads to better investment decisions. Ultimately the Investment Committee needs to have a unanimous vote in order to approve any of our investments, working in collaboration with our Chief Investment Officer and the Investment Advisor’s loan portfolio manager to size the position appropriately for the risk.
Of equal importance, the monitoring phase of each loan investment is critical to the ultimate success of the loan position. Detailed quarterly writeups and model updates are done for each credit after they report earnings. However, the monitoring process is not just a quarterly event as credit analysts are digesting daily information and news regarding our borrowers, their industries and their competitors.
Investment Process – CLO Debt and Equity
The Investment Advisor’s CLO debt and equity investment strategy has also been consistent throughout multiple credit environments and is focused on three main areas: structure and documentation of the CLO, the underlying portfolio of the CLO, and the collateral manager of the CLO.
The structures of CLOs have become more robust since the pre-financial crisis era, with subordination of each rated tranche essentially improving by one rating category (i.e., a current BBB-rated tranche may have similar credit support from a subordination perspective as a pre-financial crisis A-rated tranche). CLO equity leverage is also lower from the pre-financial crisis era, with the equity tranche now representing approximately 9-10% of current structures versus approximately 7% in pre-crisis structures. The Investment Advisor believes that no two CLO structures are identical, thus it is critical to analyze the nuances of each structure and the underlying documentation. For example, CLOs with higher overcollateralization cushions can help protect CLO equity from future cash diversion in a stressed scenario. From a documentation standpoint, while post-financial crisis documents are more standardized, our Investment Team works to understand the nuances of each CLO, such as optional redemption rights, collateral quality limitations, reinvestment language optionality, and the ability to flush excess par to the equity holders.
A second critical aspect of the CLO investment process is the Investment Advisor’s focus on the overall portfolio characteristics and underlying loans within a CLO. From a top-down perspective we focus on the weighted-average rating factor (“WARF”), diversity, spread, loan bid depth, facility size, rating distribution and price distribution of the entire portfolio. For example, two portfolios with a weighted-average price of $98.00 may have very different overall portfolio characteristics, such as a higher concentration in lower-rated loans, which could lead to issues during a downgrade cycle. In addition, given our strong corporate credit investment team, we focus on the individual names of the underlying portfolio, with great focus on any loans we perceive to have heightened credit risk.
The collateral manager of the CLO is the third aspect the Investment Advisor spends a significant amount of its due diligence effort analyzing. The Investment Advisor tracks data compiled from third-party sources such as Intex, Moody’s Analytics and Bloomberg, as well as proprietary internal systems to create a detailed analysis of the CLO collateral manager universe. This process leads to rankings of collateral managers based on all of these criteria. In addition to the analytical and statistical process, the Investment Advisor also performs due diligence on collateral managers via in-person meetings and via telephone calls. Our goal is to meet the collateral managers we invest in at least twice per year.
11
Investment Process – ESG Integration
We believe that integrating environmental, social and corporate governance (“ESG”) criteria and risk assessment should be an important component of our overall investment philosophy and process. PSCM formed its initial ESG policy statement and integrated an ESG framework into its investment process in 2019 and became a United Nations Principles for Responsible Investment signatory in 2020. It has also formed an ESG Committee which helps to develop and implement its ESG policies. The ESG Committee has developed and maintains a proprietary ESG scoring system. The Investment Team is responsible for utilizing the system to assign a score to each non-investment grade borrower to which the Company is a lender. Each scored non-investment grade borrower is assigned an environmental score, a social score and a governance score, with the scoring based on whether the non-investment grade borrower is determined to be subject to material environmental, social, or governance risks that may negatively impact credit quality and/or valuations and/or whether the non-investment grade borrower is believed to not be sufficiently mitigating such risks. These scores inform our underwriting and monitoring processes, but are not used on a standalone basis to approve or decline an investment. In addition, effective March 1, 2021, we have implemented policies and procedures to screen for Prohibited ESG Securities (as defined below) in our potential investments. Our Investment Committee, together with PSCM’s ESG Committee, is responsible for monitoring our investments to ensure that our ESG guidelines are met.
Our ESG guidelines state that we will not directly purchase any “Prohibited ESG Security.” We define a “Prohibited ESG Security” as any debt obligation of, equity interest in, or credit default swap referencing a company where the consolidated group is a group whose Primary Business Activity (as defined below) at the time of purchase is: (i) the speculative extraction of oil and gas (commonly referred to as exploration and production); (ii) the speculative extraction of thermal coal or the generation of electricity using coal; (iii) the production of or trade in Controversial Weapons (as defined below); (iv) the production of or trade in components or services that have been specifically designed or designated for military purposes for the functioning of Controversial Weapons; or (v) the trade in (a) hazardous chemicals, pesticides and wastes, ozone depleting substances, endangered or protected wildlife or wildlife products, of which production or trade is banned by applicable global conventions and agreements; (b) pornography or prostitution; (c) tobacco or tobacco-related products; (d) subprime lending or payday lending activities; or (e) weapons or firearms. We define “Controversial Weapons” as any controversial weapons (such as cluster bombs, anti-personnel mines, chemical or biological weapons) which are prohibited under applicable international treaties or conventions. We define “Primary Business Activity” as, in relation to a consolidated group of companies, for the purposes of determining whether a security is a Prohibited ESG Security, where such group derives more than 50 percent of its revenues for the relevant business, trade or production (as applicable).
Following its effectiveness on March 1, 2021, our ESG guidelines are followed by our Investment Committee on a go-forward basis, and certain of our investments held prior to March 1, 2021, including as set forth in the schedule of investments herein or in our prior quarterly reports on Form 10-Q, may not have satisfied our newly adopted ESG guidelines. Our Investment Committee is responsible for the execution and continued progress of integration of ESG criteria into our investment strategy, and will support efforts to collaborate with our investors and others in the investment industry to assess and prioritize the ESG topics that are most relevant to the Company and our investors.
Investment Process — Ongoing Portfolio Monitoring
The Investment Advisor employs an active relative value scoring system to monitor portfolio investments throughout the life of a loan. Existing positions are assigned a score of 5 to 1 to each position, which is updated on an ongoing basis and the Investment Advisor’s analysts incorporate both a fundamental and relative value view. The scoring system is as follows:
Investment Committee
The Investment Advisor’s Investment Committee is chaired by Angie K. Long, and the other members of the Investment Committee are Christopher D. Long, Matthew L. Bloomfield and Jeffrey D. Fox. The members of the Investment Committee are jointly responsible for the day to day management of the portfolio, and have equal rights with respect to the management of the portfolio. The extensive experience of the investment professionals serving on our Investment Committee includes expertise in privately originated and publicly traded leveraged credit, stressed and distressed debt, bankruptcy, mergers and acquisitions and private equity. This diverse skill set provides a range of perspectives in the evaluation of each investment opportunity.
Competition
Our primary competitors in investing in corporate debt and CLO securities include public and private funds, other BDCs, commercial and investment banks, commercial financing companies and, to the extent they provide an alternative form of financing, private equity and hedge funds. Many of our competitors are substantially larger and have considerably greater financial, technical and marketing resources than we do. For example, we believe some competitors may have access to funding sources that are not available to us. In addition, some of our competitors may have higher risk tolerances or different risk assessments, which could allow them to consider a wider variety of investments and establish more relationships than us. Furthermore, many of our competitors are not subject to the regulatory restrictions that the 1940 Act imposes on us as a BDC or to the distribution and other requirements we must satisfy as a RIC.
We use the expertise of the investment professionals of PSCM to which we have access pursuant to the Resource Sharing Agreement to assess investment risks and determine appropriate pricing for our investments in portfolio companies. In addition, we seek to use the relationships of the Investment Advisor to enable us to learn about, and compete effectively for, financing opportunities with attractive small to large private companies in the industries in which we seek to invest. For additional information concerning the competitive risks we face, see “Item 1A. Risk Factors—Risks Relating to our Business and Structure—We operate in a highly competitive market for investment opportunities, which could reduce returns and result in losses.”
12
Expenses
Our primary operating expenses include the payment of fees to the Investment Advisor under the Advisory Agreement, our allocable portion of overhead and rental expenses under the Administration Agreement and other operating costs described below. We bear all other out-of-pocket costs and expenses of our operations and transactions, including:
Implications of Being an Emerging Growth Company
We currently are, and expect to remain, an “emerging growth company,” as that term is used in the JOBS Act, until the earliest of:
Under the JOBS Act, we are exempt from the provisions of Section 404(b) of the Sarbanes-Oxley Act of 2002 (the “Sarbanes-Oxley Act”), which would require that our independent registered public accounting firm provide an attestation report on the effectiveness of our internal control over financial reporting. This may increase the risk that material weaknesses or other deficiencies in our internal control over financial reporting go undetected.
In addition, as an emerging growth company, we have elected to take advantage of the extended transition period provided in Section 7(a)(2)(B) of the Securities Act and Section 13(a) of the Exchange Act for complying with new or revised accounting standards.
Employees
We do not currently have any employees. Each officer of the Company is an employee of the Investment Advisor or its affiliates. See “Item 10. Directors, Executive Officers, and Corporate Governance.”
Our day-to-day investment operations are managed by the Investment Advisor. Pursuant to its Resource Sharing Agreement with PSCM, the Investment Advisor has access to the individuals who comprise our Investment Advisor’s Investment Committee and Investment Team. The Investment Advisor may hire additional investment professionals to provide services to us, based upon its needs. See above “Item 1. Business — The Investment Advisor.”
Open Market Share Repurchase Plan
Our Board authorized us to repurchase shares of our common stock through an open-market share repurchase program for up to $20 million in the aggregate of shares of our common stock through 12 months from the date of the IPO. Pursuant to such authorization and concurrently with the closing of the IPO, we entered into a share repurchase plan (the “Company Rule 10b5-1 Stock Repurchase Plan”) to acquire up to $15 million in the aggregate of shares of our common stock, in accordance with the guidelines specified in Rule 10b-18 and Rule 10b5-1 of the Exchange Act.
13
The Company Rule 10b5-1 Stock Repurchase Plan is intended to allow us to repurchase shares of our common stock at times when we otherwise might be prevented from doing so under insider trading laws. The Company Rule 10b5-1 Stock Repurchase Plan will require our agent to repurchase shares of common stock on our behalf when the market price per share of our common stock is below the most recently reported NAV per share of our common stock (including any updates, corrections or adjustments publicly announced by us to any previously announced NAV per share). Under the Company Rule 10b5-1 Stock Repurchase Plan, the agent will increase the volume of purchases made as the price of our common stock declines, subject to volume restrictions.
The repurchase of shares pursuant to the Company Rule 10b5-1 Stock Repurchase Plan is intended to satisfy the conditions of Rule 10b5-1 and Rule 10b-18 under the Exchange Act and will otherwise be subject to applicable law, including Regulation M, which may prohibit purchases under certain circumstances.
The Company Rule 10b5-1 Stock Repurchase Plan commenced on March 23, 2024, beginning 60 calendar days following the end of the “restricted period” under Regulation M, and will terminate upon the earliest to occur of (i) 12 months from the date of the Company Rule 10b5-1 Stock Repurchase Plan, (ii) the end of the trading day on which the aggregate purchase price for all shares purchased under the Company Rule 10b5-1 Stock Repurchase Plan equals $15 million and (iii) the occurrence of certain other events described in the Company Rule 10b5-1 Stock Repurchase Plan.
For the year ended December 31, 2024, the Company repurchased 78,964 shares of its common stock pursuant to the Company Rule 10b5-1 Repurchase Plan.
PSCM Rule 10b5-1 Stock Purchase Plan
In addition, PSCM will purchase up to $5 million in the aggregate of shares of our common stock in the open market within one year of the date of the IPO if our shares of common stock trade below a specific level of NAV per share following the completion of the IPO. In order to facilitate PSCM’s purchase commitment, concurrently with the closing of the IPO, PSCM entered into a share purchase plan (the “PSCM Rule 10b5-1 Stock Purchase Plan”) to permit the purchase of up to $2.5 million of our shares of common stock. The purchases of shares pursuant to the PSCM Rule 10b5-1 Stock Purchase Plan will be implemented in accordance with Rule 10b5-1 and Rule 10b-18 under the Exchange Act.
The PSCM Rule 10b5-1 Stock Purchase Plan is intended to allow PSCM to purchase shares of our common stock at times when it otherwise might be prevented from doing so under insider trading laws. The PSCM Rule 10b5-1 Stock Purchase Plan will require PSCM’s agent to purchase shares of common stock on PSCM’s behalf when the market price per share of our common stock is trading below the most recently reported NAV per share of our common stock (including any updates, corrections or adjustments publicly announced by us to any previously announced NAV per share). Under the PSCM Rule 10b-1 Stock Purchase Plan, the agent will increase the volume of purchases made as the price of our common stock declines, subject to volume restrictions.
The purchase of shares pursuant to the PSCM Rule 10b5-1 Stock Purchase Plan is intended to satisfy the conditions of Rule 10b5-1 and Rule 10b-18 under the Exchange Act, and will otherwise be subject to applicable law, including Regulation M, which may prohibit purchases under certain circumstances.
The PSCM Rule 10b5-1 Stock Purchase Plan commenced on March 23, 2024 and will terminate upon the earliest to occur of (i) 12 months from the date of the PSCM Rule 10b5-1 Stock Purchase Plan, (ii) the end of the trading day on which the aggregate purchase price for all shares purchased under the PSCM Rule 10b5-1 Stock Purchase Plan equals $2.5 million, and (iii) the occurrence of certain other events described in the PSCM Rule 10b5-1 Stock Purchase Plan.
For the year ended December 31, 2024, PSCM did not repurchase any shares of the Company’s common stock pursuant to the PSCM Rule 10b5-1 Stock Purchase Plan.
Regulation as a Business Development Company
We have elected to be regulated as a BDC under the 1940 Act. A BDC must be organized in the United States for the purpose of investing in or lending to primarily private companies and making significant managerial assistance available to them.
We may not change the nature of our business so as to cease to be, or withdraw our election as, a BDC unless authorized by vote of a majority of the outstanding voting securities, as required by the 1940 Act. A majority of the outstanding voting securities of a company is defined under the 1940 Act as the lesser of: (a) 67% or more of such company’s voting securities present at a meeting if more than 50% of the outstanding voting securities of such company are present or represented by proxy, or (b) more than 50% of the outstanding voting securities of such company.
As with other companies regulated by the 1940 Act, a BDC must adhere to certain substantive regulatory requirements. A majority of our directors must be persons who are not interested persons, as that term is defined in the 1940 Act. Additionally, we are required to provide and maintain a bond issued by a reputable fidelity insurance company to protect the BDC. Furthermore, as a BDC, we are prohibited from protecting any director or officer against any liability to us or our stockholders arising from willful misfeasance, bad faith, gross negligence or reckless disregard of the duties involved in the conduct of such person’s office.
We are required to meet an asset coverage ratio, defined under the 1940 Act as the ratio of our total assets (less all liabilities and indebtedness not represented by senior securities) to our outstanding senior securities, of at least 150% after each issuance of senior securities.
We may also be prohibited under the 1940 Act from knowingly participating in certain transactions with our affiliates without the prior approval of our directors who are not interested persons, as defined in Section 2(a)(19) of the 1940 Act, and, in some cases, prior approval by the SEC. As a BDC, we are limited in our ability to invest in any portfolio company in which our Investment Advisor or any of its affiliates currently has an investment or to make any co-investments with our Investment Advisor or its affiliates without an exemptive order from the SEC, subject to certain exceptions.
14
We do not intend to acquire securities issued by any investment company that exceed the limits imposed by the 1940 Act. Under these limits, except for registered money market funds, we generally cannot acquire more than 3% of the voting stock of any investment company, invest more than 5% of the value of our total assets in the securities of one investment company or invest more than 10% of the value of our total assets in the securities of investment companies in the aggregate. The portion of our portfolio invested in securities issued by investment companies ordinarily will subject our stockholders to additional expenses. Our investment portfolio is also subject to diversification requirements by virtue of our qualification as a RIC for U.S. tax purposes and our intention to continue to operate in a manner so as to qualify for the tax treatment applicable to RICs.
We will generally not be able to issue and sell our common stock at a price below net asset value per share. We may, however, sell our common stock, or warrants, options or rights to acquire our common stock, at a price below the then-current net asset value of our common stock if our Board determines that such sale is in our best interests and the best interests of our stockholders, and our stockholders approve such sale. We will comply with the conditions set forth in Section 63(2) of the 1940 Act when selling our common stock at a price below net asset value. In addition, we may generally issue new shares of our common stock at a price below net asset value in rights offerings to existing stockholders, in payment of dividends and in certain other limited circumstances.
We will be periodically examined by the SEC for compliance with the 1940 Act.
Qualifying Assets
Under the 1940 Act, a BDC may not acquire any assets other than assets of the type listed in section 55(a) of the 1940 Act, which are referred to as qualifying assets, unless, at the time the acquisition is made, qualifying assets represent at least 70% of the company’s total assets. The principal categories of qualifying assets relevant to our business are the following:
Limitations on Leverage
We are required to meet an asset coverage ratio, defined under the 1940 Act as the ratio of our total assets (less all liabilities and indebtedness not represented by senior securities) to our outstanding senior securities, of at least 150% after each issuance of senior securities.
Managerial Assistance to Portfolio Companies
A BDC must be operated for the purpose of making investments in the types of securities described under “—Regulation as a Business Development Company—Qualifying Assets,” above. However, in order to count portfolio securities as qualifying assets for the purpose of the 70% test, the BDC must either control the issuer of the securities or must offer to make available to the issuer of the securities significant managerial assistance. Making available managerial assistance means, among other things, any arrangement whereby the BDC, through its directors, officers or employees, offers to provide, and, if accepted, does in fact provide, significant guidance and counsel concerning the management, operations or business objectives and policies of a portfolio company.
15
Temporary Investments
Pending investment in other types of “qualifying assets,” as described above, our investments may consist of cash, cash equivalents, U.S. Government securities or high-quality debt securities maturing in one year or less from the time of investment, which we refer to, collectively, as temporary investments, such that at least 70% of our assets are qualifying assets.
Senior Securities
We are permitted, under specified conditions, to issue multiple classes of indebtedness and one class of stock senior to our common stock if our asset coverage, as defined in the 1940 Act, is at least equal to 150% immediately after each such issuance. In addition, while any senior securities remain outstanding, we must make provisions to prohibit any distribution to our stockholders or the repurchase of such securities or shares unless we meet the applicable asset coverage ratios at the time of the distribution or repurchase. We may also borrow amounts up to 5% of the value of our total assets for temporary or emergency purposes without regard to asset coverage.
Code of Ethics
We and our Investment Advisor have adopted codes of ethics pursuant to Rule 17j-1 under the 1940 Act and Rule 204A-1 under the Advisers Act, respectively, that establish procedures for personal investments and restrict certain transactions by our personnel. The codes of ethics generally do not permit investments by our employees or employees of our Investment Advisor in securities that may be purchased or held by us.
We hereby undertake to provide a copy of the codes to any person, without charge, upon request. Requests for a copy of the codes may be made in writing addressed to Palmer Square Capital BDC Inc., Attention: Secretary, 1900 Shawnee Mission Parkway, Suite 315, Mission Woods, Kansas 66205, or by emailing us at: investorrelations@palmersquarecap.com.
Compliance Policies and Procedures
We and our Investment Advisor have adopted and implemented written policies and procedures reasonably designed to detect and prevent violation of the federal securities laws and are required to review these compliance policies and procedures annually for their adequacy and the effectiveness of their implementation and designate a chief compliance officer to be responsible for administering the policies and procedures.
Exchange Act and Sarbanes-Oxley Act Compliance
The Sarbanes-Oxley Act of 2002 imposes a wide variety of regulatory requirements on certain publicly held companies and their insiders. Assuming certain requirements are met, many of these requirements affect us. For example:
The Sarbanes-Oxley Act requires us to review our current policies and procedures to determine whether we comply with the Sarbanes-Oxley Act and the regulations promulgated thereunder. We continue to monitor our compliance with all regulations that are adopted under the Sarbanes-Oxley Act and will take actions necessary to ensure that we are in compliance therewith.
Proxy Voting Policies and Procedures
We have delegated our proxy voting responsibility to our Investment Advisor. The Proxy Voting Policies and Procedures of our Investment Advisor are set forth below. The guidelines are reviewed periodically by our Investment Advisor and our Independent Directors, and, accordingly, are subject to change.
An investment adviser registered under the Advisers Act has a fiduciary duty to act solely in the best interests of its clients. As part of this duty, our Investment Advisor recognizes that it must vote client securities in a timely manner free of conflicts of interest and in the best interests of its clients. These policies and procedures for voting proxies for our Investment Advisor’s investment advisory clients are intended to comply with Section 206 of, and Rule 206(4)-6 under, the Advisers Act.
Our Investment Advisor intends to vote proxies relating to our securities in the best interest of the Company’s stockholders. It reviews on a case-by-case basis each proposal submitted for a stockholder vote to determine its impact on the portfolio securities held by the Company. Although our Investment Advisor will generally vote against proposals that may have a negative impact on the Company’s portfolio securities, it may vote for such a proposal if there exists compelling long-term reasons to do so.
16
The proxy voting decisions of our Investment Advisor are made by the senior officers who are responsible for monitoring each of the Company’s investments. To ensure that its vote is not the product of a conflict of interest, it will require that: (a) anyone involved in the decision-making process disclose to its chief compliance officer any potential conflict that he or she is aware of and any contact that he or she has had with any interested party regarding a proxy vote; and (b) employees involved in the decision making process or vote administration are prohibited from revealing how our Investment Advisor intends to vote on a proposal in order to reduce any attempted influence from interested parties.
You may obtain information without charge about how our Investment Advisor voted proxies by making a written request for proxy voting information to: Palmer Square Capital BDC Inc., 1900 Shawnee Mission Parkway, Suite 315, Mission Woods, Kansas 66205, Attention: Investor Relations.
Privacy Principles
The Company looks to protect nonpublic personal data. The Company’s privacy policy summarized below is intended to be compliant with the federal and state regulations as applied to the Company.
From time to time, nonpublic personal information of our stockholders may be collected as required for legitimate business purposes. The Company may share all of the information that we collect with our Investment Advisor and its affiliates in order to service stockholder accounts or provide stockholders with information about other products and services offered by the Company or the Investment Advisor or its affiliates that may be of interest to them.
In addition, the Company may disclose all of the information that it collects about stockholders to certain third parties who are not affiliated with the Company or the Investment Advisor or its affiliates under one or more of the following circumstances:
The Company and the Investment Advisor and its affiliates restrict access to nonpublic personal information about stockholders internally to those of their respective employees and agents who need to know the information to enable them to provide services to the stockholders. The Company and the Investment Advisor and its affiliates maintain physical, electronic and procedural safeguards to guard stockholder’s nonpublic personal information.
Reporting Obligations
We are a reporting company under the Exchange Act and are required to comply with all periodic reporting, proxy solicitation and other applicable requirements under the Exchange Act.
We will furnish our stockholders with annual reports containing audited consolidated financial statements, quarterly reports, and such other periodic reports as we determine to be appropriate or as may be required by law. As a BDC, we are required to file quarterly reports on Form 10-Q, annual reports on Form 10-K and current reports on Form 8-K with the SEC. The SEC maintains an Internet site that contains reports, proxy and information statements and other information filed electronically by us with the SEC which is available on the SEC’s Internet site at http://www.sec.gov. We also make available, free of charge, on our website (www.palmersquarebdc.com) our proxy statement, Annual Report on Form 10-K, Quarterly Reports on Form 10-Q, current reports on Form 8-K and amendments to those reports as soon as reasonably practicable after we electronically file such material with, or furnish it to the SEC. Information contained on our website is not incorporated by reference into this annual report on Form 10-K and you should not consider information contained on our website to be part of this annual report on Form 10-K or any other report we file with the SEC.
17
Certain U.S. Federal Income Tax Considerations
The following discussion is a general summary of the material U.S. federal income tax considerations applicable to us and to an investment in our shares. This summary does not purport to be a complete description of the income tax considerations applicable to such an investment. For example, we have not described tax consequences that may be relevant to certain types of holders subject to special treatment under U.S. federal income tax laws, including stockholders subject to the alternative minimum tax, tax-exempt organizations, insurance companies, dealers in securities, pension plans and trusts, financial institutions, partnerships and other pass-through entities, U.S. stockholders (as defined below) whose functional currency is not the U.S. dollar, persons who mark-to-market our shares and persons who hold our shares as part of a “straddle,” “hedge” or “conversion” transaction. This summary assumes that investors hold our common stock as capital assets (within the meaning of the Code). The discussion is based upon the Code, Treasury regulations, and administrative and judicial interpretations, each as of the date hereof and all of which are subject to change, possibly retroactively, which could affect the continuing validity of this discussion. We have not sought and will not seek any ruling from the Internal Revenue Service (the “IRS”) regarding any matter discussed herein. Tax counsel has not rendered any legal opinion regarding any tax consequences relating to us or our stockholders. This summary does not discuss any aspects of U.S. estate or gift tax or foreign, state or local tax. It does not discuss the special treatment under U.S. federal income tax laws that could result if we invested in tax-exempt securities or certain other investment assets.
For purposes of this discussion, a “U.S. stockholder” generally is a beneficial owner of shares of our common stock who is for U.S. federal income tax purposes:
A “Non-U.S. stockholder” generally is a beneficial owner of shares of our common stock that is not a U.S. stockholder.
If a partnership (including an entity treated as a partnership for U.S. federal income tax purposes) holds shares of our common stock, the tax treatment of a partner in the partnership will generally depend upon the status of the partner and the activities of the partnership. A prospective stockholder that is a partner in a partnership holding shares of our common stock should consult his, her or its tax advisers with respect to the purchase, ownership and disposition of shares of our common stock.
Tax matters are complicated and the tax consequences to an investor of an investment in our shares will depend on the facts of the investor’s particular situation. We encourage investors to consult their own tax advisers regarding the specific consequences of such an investment, including tax reporting requirements, the applicability of federal, state, local and foreign tax laws, including the potential application of U.S. withholding taxes, eligibility for the benefits of any applicable tax treaty and the effect of any possible changes in the tax laws.
Election to be Taxed as a RIC
As a BDC, we have elected, and intend to qualify annually, as a RIC under Subchapter M of the Code, beginning with our initial taxable year ended December 31, 2020. As a RIC, we generally will not have to pay corporate-level U.S. federal income taxes on any income that we distribute (or are deemed to distribute) to our stockholders from our earnings and profits. To qualify for and maintain our qualification as a RIC, we must, among other things, meet certain source-of-income and asset diversification requirements (as described below). In addition, to obtain RIC tax treatment, we must timely distribute to our stockholders, for each taxable year, at least 90% of our “investment company taxable income,” which is generally our net ordinary income plus the excess, if any, of realized net short-term capital gains over realized net long-term capital losses (the “Annual Distribution Requirement”).
Taxation as a RIC
If we:
then we will not be subject to U.S. federal income tax on the portion of our investment company taxable income and net capital gain (generally defined as net long-term capital gains in excess of short-term capital losses) we distribute (or are deemed to distribute) to stockholders. We will be subject to U.S. federal income tax at regular corporate rates on any net income or net capital gain not distributed (or deemed distributed) to our stockholders.
We will be subject to a nondeductible U.S. federal excise tax of 4% on certain undistributed income unless we distribute in a timely manner an amount at least equal to the sum of (1) 98% of our net ordinary income for each calendar year, (2) 98.2% of our capital gain net income for the one-year period ending October 31 of that calendar year and (3) any income realized, but not distributed, in preceding years and on which we paid no federal income tax (“Excise Tax Distribution Requirement”).
To qualify as a RIC for federal income tax purposes, we must, among other things:
18
To the extent that we invest in entities treated as partnerships for U.S. federal income tax purposes (other than a “qualified publicly traded partnership”), we generally must include the items of gross income derived by the partnerships for purposes of the 90% Income Test, and the income that is derived from a partnership (other than a “qualified publicly traded partnership”) will be treated as qualifying income for purposes of the 90% Income Test only to the extent that such income is attributable to items of income of the partnership which would be qualifying income if realized by us directly. In addition, we generally must take into account our proportionate share of the assets held by partnerships in which we are a partner (other than a “qualified publicly traded partnership”) for purposes of the Diversification Tests.
A RIC is limited in its ability to deduct expenses in excess of its investment company taxable income. If our deductible expenses in a given taxable year exceed our investment company taxable income, we may incur a net operating loss for that taxable year. However, a RIC is not permitted to carry forward net operating losses to subsequent taxable years and such net operating losses do not pass through to its stockholders. In addition, deductible expenses can be used only to offset investment company taxable income, not net capital gain. A RIC may not use any net capital losses (that is, the excess of realized capital losses over realized capital gains) to offset its investment company taxable income, but may carry forward such net capital losses, and use them to offset future capital gains, indefinitely. Due to these limits on deductibility of expenses and net capital losses, we may for tax purposes have aggregate taxable income for several taxable years that we are required to distribute and that is taxable to our stockholders even if such taxable income is greater than the net income we actually earn during those taxable years.
Certain of our investment practices may be subject to special and complex U.S. federal income tax provisions that may, among other things, (1) treat distributions that would otherwise constitute qualified distribution income as non-qualified distribution income, (2) treat distributions that would otherwise be eligible for the corporate dividends-received deduction as ineligible for such treatment, (3) disallow, suspend or otherwise limit the allowance of certain losses or deductions, (4) convert lower-taxed long-term capital gain into higher-taxed short-term capital gain or ordinary income, (5) convert an ordinary loss or a deduction into a capital loss (the deductibility of which is more limited), (6) cause us to recognize income or gain without a corresponding receipt of cash, (7) adversely affect the time as to when a purchase or sale of shares or securities is deemed to occur, (8) adversely alter the characterization of certain complex financial transactions and (9) produce income that will not be qualifying income for purposes of the 90% Income Test. We intend to monitor our transactions and may make certain tax elections to mitigate the effect of these provisions and prevent our ability to be subject to tax as a RIC.
Gain or loss realized by us from warrants acquired by us as well as any loss attributable to the lapse of such warrants generally will be treated as capital gain or loss. Such gain or loss generally will be long-term or short-term, depending on how long we held a particular warrant.
For federal income tax purposes, we may be required to recognize taxable income in circumstances in which we do not receive a corresponding payment in cash. For example, if we hold debt obligations that are treated under applicable tax rules as having original issue discount (such as debt instruments with PIK interest or, in certain cases, increasing interest rates or debt instruments that were issued with warrants), we must include in income each year a portion of the original issue discount that accrues over the life of the obligation, regardless of whether cash representing such income is received by us in the same taxable year. We may also have to include in income other amounts that we have not yet received in cash, such as deferred loan origination fees that are paid after origination of the loan or are paid in non-cash compensation such as warrants or stock. We anticipate that a portion of our income may constitute original issue discount or other income required to be included in taxable income prior to receipt of cash. Further, we may elect to amortize market discount and include such amounts in our taxable income in the current year, instead of upon disposition, as an election not to do so may limit our ability to deduct interest expenses for tax purposes, which is subject to other limitations under U.S. federal income tax law.
We intend to invest a portion of our net assets in below investment grade instruments (rated lower than “Baa3” by Moody’s Investors Service or lower than “BBB-” by Standard & Poor’s Corporation), which are often referred to as “junk” bonds. Investments in these types of instruments may present special tax issues for us. U.S. federal income tax rules are not entirely clear about issues such as when we may cease to accrue interest, original issue discount or market discount, when and to what extent deductions may be taken for bad debts or worthless instruments, how payments received on obligations in default should be allocated between principal and income and whether exchanges of debt obligations in a bankruptcy or workout context are taxable. We will address these and other issues to the extent necessary to seek to ensure that we distribute sufficient income so that we do not become subject to U.S. federal income or excise tax.
Because any original issue discount or other amounts accrued will be included in our investment company taxable income for the year of accrual, we may be required to make a distribution to our stockholders to satisfy the Annual Distribution Requirement, even though we will not have received any corresponding cash amount. As a result, we may have difficulty meeting the Annual Distribution Requirement necessary to qualify for and maintain RIC tax treatment under Subchapter M of the Code. We may have to sell some of our investments at times and/or at prices we would not consider advantageous, raise additional debt or equity capital or forgo new investment opportunities for this purpose. If we are not able to obtain cash from other sources, we may fail to qualify for RIC tax treatment and thus become subject to corporate-level income tax.
19
Although we do not presently expect to do so, we are authorized to borrow funds and to sell assets to satisfy distribution requirements. However, under the 1940 Act, we are not permitted to make distributions to our stockholders while our debt obligations and other senior securities are outstanding unless certain “asset coverage” tests are met. See “Regulation — Regulation as a Business Development Company — Senior Securities.” Moreover, our ability to dispose of assets to meet our distribution requirements may be limited by (1) the illiquid nature of our portfolio and/or (2) other requirements relating to our status as a RIC, including the Diversification Tests. If we dispose of assets to meet the Annual Distribution Requirement or the Excise Tax Distribution Requirement, we may make such dispositions at times that, from an investment standpoint, are not advantageous.
A portfolio company in which we invest may face financial difficulties that require us to work-out, modify or otherwise restructure its investment in the portfolio company. Any such transaction could, depending upon the specific terms of the transaction, result in unusable capital losses and future non-cash income. Any such transaction could also result in our receiving assets that give rise to income that is not qualifying income for purposes of the 90% Income Test.
Our investment in non-U.S. securities may be subject to non-U.S. income, withholding and other taxes. In that case, our yield on those securities would be decreased. Stockholders generally will not be entitled to claim a U.S. foreign tax credit or deduction with respect to non-U.S. taxes paid by the Company.
We may invest in stocks of foreign companies that are classified under the Code as passive foreign investment companies (“PFICs”). In general, a foreign company is classified as a PFIC if at least 50% of its assets constitute investment-type assets or 75% or more of its gross income is investment-type income. In general, under the PFIC rules, an “excess distribution” received with respect to PFIC stock is treated as having been realized ratably over the period during which we held the PFIC stock. We will be subject to tax on the portion, if any, of the excess distribution that is allocated to our holding period in prior taxable years (and an interest factor will be added to the tax, as if the tax had actually been payable in such prior taxable years) even though we distribute the corresponding income to stockholders. Excess distributions include any gain from the sale of PFIC stock as well as certain distributions from a PFIC. All excess distributions are taxable as ordinary income.
We may be eligible to elect alternative tax treatment with respect to PFIC stock. Under such an election, we generally would be required to include in our gross income its share of the earnings of a PFIC on a current basis, regardless of whether any distributions are received from the PFIC. If this election is made, the special rules, discussed above, relating to the taxation of excess distributions, would not apply. Alternatively, we may be able to elect to mark to market our PFIC stock, resulting in any unrealized gains at year end being treated as though they were realized and reported as ordinary income. Any mark-to-market losses and any loss from an actual disposition of the PFIC’s shares would be deductible as ordinary losses to the extent of any net mark-to-market gains included in income in prior years with respect to stock in the same PFIC.
Because the application of the PFIC rules may affect, among other things, the character of gains, the amount of gain or loss and the timing of the recognition of income with respect to PFIC stock, as well as subject us to tax on certain income from PFIC stock, the amount that must be distributed to stockholders, and which will be taxed to stockholders as ordinary income or long-term capital gain, may be increased or decreased substantially as compared to a fund that did not invest in PFIC stock.
Under the Code, gains or losses attributable to fluctuations in foreign currency exchange rates that occur between the time we accrue interest income or other receivables or accrues expenses or other liabilities denominated in a foreign currency and the time we actually collect such receivables or pays such liabilities generally are treated as ordinary income or ordinary loss. Similarly, on disposition of some investments, including debt securities and certain forward contracts denominated in a foreign currency, gains or losses attributable to fluctuations in the value of foreign currency between the date of acquisition of the security or contract and the date of disposition also are treated as ordinary gain or loss. These gains and losses, referred to under the Code as “section 988” gains and losses, may increase or decrease the amount of our investment company taxable income to be distributed to stockholders as ordinary income. For example, fluctuations in exchange rates may increase the amount of income that we must distribute in order to qualify for treatment as a RIC and to prevent application of an excise tax on undistributed income. Alternatively, fluctuations in exchange rates may decrease or eliminate income available for distribution. If section 988 losses exceed other investment company taxable income during a taxable year, we would not be able to make ordinary distributions, or distributions made before the losses were realized would be re-characterized as a return of capital to stockholders for U.S. federal income tax purposes, rather than as ordinary dividend income, and would reduce each stockholder’s basis in our shares.
Distributions from capital gains generally are made after applying any available capital loss carryforwards. Capital loss carryforwards are reduced to the extent they offset current-year net realized capital gains, whether we retain or distribute such gains. If we incur or have incurred capital losses in excess of capital gains (“net capital losses”), those losses will be carried forward to one or more subsequent taxable years; any such carryforward losses will retain their character as short-term or long-term. In the event that we were to experience an ownership change as defined under the Code, our capital loss carryforwards and other favorable tax attributes, if any, may be subject to limitation.
In determining our net capital gain, including also in connection with determining the amount available to support a capital gain dividend, our taxable income and our earnings and profits, we generally may elect to treat part or all of any post-October capital loss (defined as any net capital loss attributable to the portion, if any, of the taxable year after October 31 or, if there is no such loss, the net long-term capital loss or net short-term capital loss attributable to any such portion of the taxable year) or late-year ordinary loss (generally, the sum of (i) our net ordinary loss, if any, from the sale, exchange or other taxable disposition of property, attributable to the portion, if any, of the taxable year after October 31, and (ii) our other net ordinary loss, if any, attributable to the portion, if any, of the taxable year after December 31) as if incurred in the succeeding taxable year.
20
Failure to Qualify as a RIC
If we were unable to qualify for treatment as a RIC, we would be subject to tax on all of our taxable income at regular corporate rates, regardless of whether we make any distributions to our stockholders. Distributions would not be required, and any distributions would be taxable to our stockholders as ordinary dividend income to the extent of our current and accumulated earnings and profits. Subject to certain limitations in the Code, such distributions may be eligible for the preferential maximum rate applicable to qualified dividend income of individual stockholders to the extent of our current and accumulated earnings and profits. Subject to certain limitations under the Code, corporate distributees may be eligible for a dividends-received deduction. Distributions in excess of our current and accumulated earnings and profits would be treated first as a return of capital to the extent of the stockholder’s tax basis, and any remaining distributions would be treated as a capital gain.
To requalify as a RIC in a subsequent taxable year, we would be required to satisfy the RIC qualification requirements for that year and dispose of any earnings and profits from any year in which we failed to qualify as a RIC. Subject to a limited exception applicable to RICs that qualified as such under the Code for at least one year prior to disqualification and that requalify as a RIC no later than the second year following the nonqualifying year, we would be subject to tax on any unrealized net built-in gains in the assets held by us during the period in which we failed to qualify as a RIC that are recognized within the subsequent 5 years, unless we made a special election to pay corporate-level U.S. federal income tax on such built-in gains at the time of our requalification as a RIC. We may decide to be taxed as a regular corporation even if we would otherwise qualify as a RIC if we determine that treatment as a corporation for a particular year would be in our best interests.
The remainder of this discussion assumes that we qualify as a RIC and satisfy the Annual Distribution Requirement.
Taxation of U.S. Stockholders
Distributions by us generally are taxable to U.S. stockholders as ordinary income or capital gains, whether paid in cash or reinvested in additional shares. Distributions of our “investment company taxable income” (which is, generally, our net ordinary income plus realized net short-term capital gains in excess of realized net long-term capital losses) will be taxable as ordinary income to U.S. stockholders to the extent of our current or accumulated earnings and profits, whether paid in cash or reinvested in additional common stock. To the extent such distributions paid by us to non-corporate stockholders (including individuals) are attributable to dividends from U.S. corporations and certain qualified foreign corporations, such distributions (“Qualifying Dividends”) may be eligible for a maximum tax rate of 20%, provided that we properly report such distribution as “qualifying dividend income” in a written statement furnished to our stockholders and certain holding period and other requirements are satisfied. In this regard, it is not anticipated that a significant portion of distributions paid by us will be attributable to qualifying dividends; therefore, our distributions generally will not qualify for the preferential maximum rate applicable to Qualifying Dividends. Distributions of our net capital gain (which is generally our realized net long-term capital gains in excess of realized net short-term capital losses) properly reported by us as “capital gain dividends” will be taxable to a U.S. stockholder as long-term capital gains that are currently generally taxable at a maximum rate of 20% in the case of individuals, trusts or estates, regardless of the U.S. stockholder’s holding period for his, her or its common stock and regardless of whether paid in cash or reinvested in additional common stock. Distributions in excess of our earnings and profits first will reduce a U.S. stockholder’s adjusted tax basis in such stockholder’s common stock and, after the adjusted basis is reduced to zero, will constitute capital gains to such U.S. stockholder.
Although we currently intend to distribute any long-term capital gain at least annually, we may in the future decide to retain some or all of our long-term capital gain, but report the retained amount as a “deemed distribution.” In that case, among other consequences, we will pay tax on the retained amount, each U.S. stockholder will be required to include his, her or its proportionate share of the deemed distribution in income as if it had been actually distributed to the U.S. stockholder, and the U.S. stockholder will be entitled to claim a credit equal to his, her or its allocable share of the tax paid thereon by us. The amount of the deemed distribution net of such tax will be added to the U.S. stockholder’s tax basis for his, her or its common stock. Since we expect to pay tax on any retained capital gain at our regular corporate tax rate, and since that rate is in excess of the maximum rate currently payable by individuals on net capital gain, the amount of tax that individual stockholders will be treated as having paid and for which they will receive a credit will exceed the tax they owe on the retained net capital gain. Such excess generally may be claimed as a credit against the U.S. stockholder’s other U.S. federal income tax obligations or may be refunded to the extent it exceeds a stockholder’s liability for U.S. federal income tax. A stockholder that is not subject to U.S. federal income tax or otherwise required to file a U.S. federal income tax return would be required to file a U.S. federal income tax return on the appropriate form to claim a refund for the taxes we paid. To utilize the deemed distribution approach, we must provide written notice to our stockholders prior to the expiration of 60 days after the close of the relevant taxable year. We cannot treat any of our investment company taxable income as a “deemed distribution.”
For purposes of determining (1) whether the Annual Distribution Requirement is satisfied for any year and (2) the amount of distributions paid for that year, we may, under certain circumstances, elect to treat a distribution that is paid during the following taxable year as if it had been paid during the taxable year in question. If we make such an election, the U.S. stockholder will still be treated as receiving the distribution in the taxable year in which the distribution is made. However, any distribution declared by us in October, November or December of any calendar year, payable to stockholders of record on a specified date in such a month and actually paid during January of the following year, will be treated as if it had been received by our U.S. stockholders on December 31 of the year in which the distribution was declared.
If an investor purchases shares of our common stock shortly before the record date of a distribution, the price of the shares will include the value of the distribution and the investor will be subject to tax on the distribution even though economically it may represent a return of his, her or its investment.
Certain distributions reported by us as section 163(j) interest dividends may be treated as interest income by shareholders for purposes of the tax rules applicable to interest expense limitations under section 163(j) of the Code. Such treatment by the shareholder is generally subject to holding period requirements and other potential limitations, although the holding period requirements are generally not applicable to dividends declared by money market funds and certain other funds that declare dividends daily and pay such dividends on a monthly or more frequent basis. The amount that we are eligible to report as a section 163(j) dividend for a tax year is generally limited to the excess of our business interest income over the sum of our (i) business interest expense and (ii) other deductions properly allocable to our business interest income.
21
Stockholders generally will recognize taxable gain or loss if the stockholder sells or otherwise disposes of his, her or its shares of our common stock. The amount of gain or loss will be measured by the difference between such stockholder’s adjusted tax basis in the common stock sold and the amount of the proceeds received in exchange. Any gain arising from such sale or disposition generally will be treated as long-term capital gain or loss if the stockholder has held the shares for more than one year. Otherwise, it will be classified as short-term capital gain or loss. However, any capital loss arising from the sale or disposition of shares of our common stock held for six months or less will be treated as long-term capital loss to the extent of the amount of capital gain dividends received, or undistributed capital gain deemed received, with respect to such shares. In addition, all or a portion of any loss recognized upon a disposition of shares of our common stock may be disallowed if other shares of our common stock or substantially identical position are purchased or acquired (whether through reinvestment of distributions or otherwise) within 30 days before or after the disposition.
In general, individual U.S. stockholders currently are subject to a maximum federal income tax rate of 20% on their net capital gain (i.e., the excess of realized net long-term capital gains over realized net short-term capital losses), including any long-term capital gain derived from an investment in our shares. Such rate is lower than the maximum rate on ordinary income currently payable by individuals. In addition, an additional 3.8% Medicare tax will be imposed on certain net investment income (including ordinary dividends and capital gain distributions received from us and net gains from redemptions or other taxable dispositions of our common stock) of U.S. high-income individuals, and certain estates and trusts. Corporate U.S. stockholders currently are subject to federal income tax on net capital gain at the maximum 21% corporate income tax rate also applied to ordinary income. Non-corporate stockholders with net capital losses for a year (i.e., capital losses in excess of capital gains) generally may deduct up to $3,000 of such losses against their ordinary income each year; any net capital losses of a non-corporate stockholder in excess of $3,000 generally may be carried forward and used in subsequent years as provided in the Code. Corporate stockholders generally may not deduct any net capital losses for a year but may carry back such losses for three years or carry forward such losses for five years.
We (or if a U.S. stockholder holds shares through an intermediary, such intermediary) will send to each of our U.S. stockholders, as promptly as possible after the end of each calendar year, a notice detailing, on a per share and per distribution basis, the amounts includible in such U.S. stockholder’s taxable income for such year as ordinary income and as long-term capital gain. In addition, the federal tax status of each year’s distributions generally will be reported to the IRS (including the amount of distributions, if any, eligible for the preferential maximum rate). Distributions paid by us generally will not be eligible for the dividends-received deduction. Distributions may also be subject to additional state, local and foreign taxes depending on a U.S. stockholder’s particular situation.
We are required to report adjusted cost basis information for covered securities which generally include shares of a RIC acquired after January 1, 2012 to the IRS and to taxpayers. The tax regulations require that we elect a default tax identification methodology to perform the required reporting. We have chosen the first-in-first-out (“FIFO”) method as the default tax lot identification method for our stockholders. This is the method we will use to determine which specific shares are deemed to be sold when a stockholder’s entire position is not sold in a single transaction and is the method in which “covered” share sales will be reported on a stockholder’s Form 1099. However, at the time of purchase or upon the sale of “covered” shares, stockholders may generally choose a different tax lot identification method. Stockholders should consult a tax advisor with regard to their personal circumstances as the Company and its service providers do not provide tax advice. Stockholders should contact their financial intermediaries with respect to reporting of cost basis and available elections for their accounts.
Backup Withholding. We may be required to withhold federal income tax (“backup withholding”), currently at a rate of 24%, from all distributions to any non-corporate U.S. stockholder (1) who fails to furnish us with a correct taxpayer identification number or a certificate that such stockholder is exempt from backup withholding or (2) with respect to whom the IRS notifies us that such stockholder has failed to properly report certain interest and dividend income to the IRS and to respond to notices to that effect. An individual’s taxpayer identification number generally is his or her social security number. Any amount withheld under backup withholding is allowed as a credit against the U.S. stockholder’s federal income tax liability, provided that proper information is provided to the IRS.
Reportable Transactions Reporting. If a U.S. stockholder recognizes a loss with respect to shares of our common stock of $2 million or more for an individual stockholder or $10 million or more for a corporate stockholder, the stockholder must file with the IRS a disclosure statement on Form 8886. The fact that a loss is reportable under these regulations does not affect the legal determination of whether the taxpayer’s treatment of the loss is proper. U.S. stockholders should consult their tax advisors to determine the applicability of these regulations in light of their specific circumstances.
U.S. Taxation of Tax-Exempt U.S. Stockholders
A U.S. stockholder that is a tax-exempt organization for U.S. federal income tax purposes and therefore generally exempt from U.S. federal income taxation may nevertheless be subject to taxation to the extent that it is considered to derive unrelated business taxable income (“UBTI”). The direct conduct by a tax-exempt U.S. stockholder of the activities we propose to conduct could give rise to UBTI. However, a BDC is a corporation for U.S. federal income tax purposes and its business activities generally will not be attributed to its stockholders for purposes of determining their treatment under current law.
Therefore, a tax-exempt U.S. stockholder generally should not be subject to U.S. taxation solely as a result of the stockholder’s ownership of our stock and receipt of dividends with respect to such stock. Moreover, under current law, if we incur indebtedness, such indebtedness generally will not be attributed to a tax-exempt U.S. stockholder. Therefore, a tax-exempt U.S. stockholder should not be treated as earning income from “debt- financed property” and dividends we pay should not be treated as “unrelated debt-financed income” solely as a result of indebtedness that we incur. Proposals periodically are made to change the treatment of “blocker” investment vehicles interposed between tax-exempt investors and non- qualifying investments. In the event that any such proposals were to be adopted and applied to BDCs, the treatment of dividends payable to tax- exempt investors could be adversely affected.
Taxation of Non-U.S. Stockholders
The following discussion applies only to Non-U.S. stockholders. Whether an investment in our shares is appropriate for a Non-U.S. stockholder will depend upon that person’s particular circumstances. An investment in our shares by a Non-U.S. stockholder may have adverse tax consequences. Non-U.S. stockholders should consult their tax advisers before investing in our common stock.
22
Distributions of our investment company taxable income to Non-U.S. stockholders (including interest income and realized net short-term capital gains in excess of realized long-term capital losses, which generally would be free of withholding if paid to Non-U.S. stockholders directly) will be subject to withholding of federal tax at a 30% rate (or lower rate provided by an applicable treaty) to the extent of our current and accumulated earnings and profits unless an applicable exception applies. If the distributions are effectively connected with a U.S. trade or business of the Non-U.S. stockholder, we will not be required to withhold federal tax if the Non-U.S. stockholder complies with applicable certification and disclosure requirements, although the distributions will be subject to federal income tax at the rates applicable to U.S. persons. (Special certification requirements apply to a Non-U.S. stockholder that is a foreign partnership or a foreign trust, and such entities are urged to consult their own tax advisers.)
In addition, with respect to certain distributions made by RICs to Non-U.S. stockholders, no withholding will be required and the distributions generally will not be subject to federal income tax if (i) the distributions are properly designated in a notice timely delivered to our stockholders as “interest-related dividends” or “short-term capital gain dividends,” (ii) the distributions are derived from sources specified in the Code for such dividends and (iii) certain other requirements are satisfied. No assurance can be given as to whether any of our distributions will be reported as eligible for this exemption from withholding tax.
Actual or deemed distributions of our net capital gains to a Non-U.S. stockholder, and gains recognized by a Non-U.S. stockholder upon the sale of our common stock, generally will not be subject to federal withholding tax and will not be subject to U.S. federal income tax unless (i) the distributions or gains, as the case may be, are effectively connected with a U.S. trade or business of the Non-U.S. stockholder and, if an income tax treaty applies, are attributable to a permanent establishment maintained by the Non-U.S. stockholder in the United States or (ii) in the case of an individual stockholder, the Non-U.S. stockholder is present in the United States for a period or periods aggregating 183 days or more during the year of the sale or the receipt of the distributions or gains and certain other conditions are met.
If we distribute our net capital gains in the form of deemed rather than actual distributions, a Non-U.S. stockholder will be entitled to a U.S. federal income tax credit or tax refund equal to the stockholder’s allocable share of the tax we pay on the capital gains deemed to have been distributed. To obtain the refund, the Non-U.S. stockholder must obtain a U.S. taxpayer identification number and file a U.S. federal income tax return even if the Non-U.S. stockholder would not otherwise be required to obtain a U.S. taxpayer identification number or file a U.S. federal income tax return. For a corporate Non-U.S. stockholder, distributions (both actual and deemed), and gains realized upon the sale of our common stock that are effectively connected to a U.S. trade or business may, under certain circumstances, be subject to an additional “branch profits tax” at a 30% rate (or at a lower rate if provided for by an applicable treaty). Accordingly, investment in the shares may not be appropriate for a Non-U.S. stockholder.
Backup Withholding. A Non-U.S. stockholder who is a non-resident alien individual, and who is otherwise subject to U.S. federal withholding tax, may be subject to information reporting and backup withholding of federal income tax on dividends unless the Non-U.S. stockholder provides us or the dividend disbursing agent with an IRS Form W-8BEN (or an acceptable substitute form) or otherwise meets documentary evidence requirements for establishing that it is a Non-U.S. stockholder or otherwise establishes an exemption from backup withholding.
Non-U.S. stockholders may also be subject to U.S. estate tax with respect to their investment in our common stock.
Foreign Account Tax Compliance Act
Legislation commonly referred to as the “Foreign Account Tax Compliance Act,” or “FATCA,” generally imposes a 30% withholding tax on payments of certain types of income to foreign financial institutions (“FFIs”) unless such FFIs either (i) enter into an agreement with the U.S. Treasury to report certain required information with respect to accounts held by U.S. persons (or held by foreign entities that have U.S. persons as substantial owners) or (ii) reside in a jurisdiction that has entered into an intergovernmental agreement (“IGA”) with the United States to collect and share such information and are in compliance with the terms of such IGA and any enabling legislation or regulations. The types of income subject to the tax include U.S. source interest and dividends. The information required to be reported includes the identity and taxpayer identification number of each account holder that is a U.S. person and transaction activity within the holder’s account. Depending on the status of a Non-U.S. stockholder and the status of the intermediaries through which they hold their shares, Non-U.S. stockholders could be subject to this 30% withholding tax with respect to distributions on their shares. Stockholders may be requested to provide additional information to us to enable us to determine whether withholding is required, such as W-8BEN, W-8BEN-E or other applicable series W-8.
Non-U.S. persons should consult their own tax advisers with respect to the U.S. federal income tax and withholding tax, and state, local and foreign tax consequences of an investment in the shares.
Legislative or Other Actions Affecting RICs
The foregoing discussion is only a summary and is based upon existing federal income tax law. You should recognize that the federal income tax treatment of an investment in us may be modified at any time by legislative, judicial or administrative action. Any such changes may have a retroactive effect with respect to existing transactions and investments and may modify the statements made above. You are urged to consult with your own tax advisor with respect to the impact of recent legislation on your investment in our shares.
THE FOREGOING DISCUSSION SHOULD NOT BE CONSIDERED TO DESCRIBE FULLY THE FEDERAL INCOME TAX CONSEQUENCES OF AN INVESTMENT IN US. YOU ARE STRONGLY ADVISED TO CONSULT WITH YOUR TAX ADVISORS WITH RESPECT TO THE FEDERAL, STATE, LOCAL AND FOREIGN INCOME TAX CONSEQUENCES OF AN INVESTMENT IN US.
23
Item 1A. Risk Factors
Investing in our common stock involves a number of significant risks. The investor should be aware of various risks, including those described below. The investor should carefully consider these risk factors, together with all of the other information included in this Annual Report. The risks set out below are not the only risks we face. Additional risks and uncertainties not presently known to us or not presently deemed material by us may also materially and adversely affect our business, financial condition and/or operating results. If any of the following events occur, our business, financial condition, results of operations and cash flows could be materially and adversely affected. In such case, the net asset value of our common stock could decline, and an investor may lose all or part of his or her investment.
Summary of Risk Factors
The following is a summary of the principal risks that you should carefully consider before investing in our securities. Further details regarding each risk included in the below summary list can be found further below.
Risks Related to our Business and Structure
We are dependent upon key personnel of PSCM and the Investment Advisor.
Pursuant to the Resource Sharing Agreement between the Investment Advisor and PSCM, PSCM provides the Investment Advisor with experienced investment professionals and services so as to enable the Investment Advisor to fulfil its obligations under the Advisory Agreement. Accordingly, our success is highly dependent on the financial and managerial expertise of the Investment Advisor and, in turn, PSCM. The individuals may not necessarily continue to remain employed by PSCM or affiliated with PSCM. Although we have attempted to foster a team approach to investing, the loss of key individuals employed by PSCM or affiliated with PSCM or our Investment Advisor, including Christopher D. Long and Angie K. Long, could have a material adverse effect on our financial condition, performance and ability to achieve our investment objectives. In addition, we cannot assure you that our Investment Advisor will remain our investment adviser or that we will continue to have access to PSCM or its investment professionals. Moreover, the Resource Sharing Agreement may be terminated by either party on 60 days’ notice; the termination of the Resource Sharing Agreement could have a material adverse effect on our financial condition, performance and ability to achieve our investment objectives.
The Investment Advisor’s and PSCM’s investment professionals expect to devote such time and attention to the conduct of our business as such business shall reasonably require. However, there can be no assurance, for example, that the members of the Investment Advisor or such investment professionals will devote any minimum number of hours each week to our affairs or that they will continue to be employed by PSCM. In the event that certain employees of the Investment Advisor cease to be actively involved with us, we will be required to rely on the ability of PSCM to identify and retain other investment professionals to conduct our business.
24
We are dependent on strong referral relationships.
We depend upon our Investment Advisor and its affiliates to maintain their relationships with private equity sponsors, placement agents, investment banks, management groups and other financial institutions, and we expect to rely to a significant extent upon these relationships to provide us with potential investment opportunities. If our Investment Advisor and its affiliates fail to maintain such relationships, or to develop new relationships with other sources of investment opportunities, we will not be able to grow our investment portfolio. In addition, individuals with whom our Investment Advisor and its affiliates have relationships are not obligated to provide us with investment opportunities, and we can offer no assurance that these relationships will generate investment opportunities for us in the future.
Our investment decisions may be expedited.
Investment analyses and decisions by the Investment Advisor may frequently be required to be undertaken on an expedited basis to take advantage of investment opportunities. In these cases, the information available to the Investment Advisor at the time of making an investment decision may be limited. Therefore, no assurance can be given that the Investment Advisor will have knowledge of all circumstances that may adversely affect an investment.
Our financial condition, results of operations and cash flows depend on our ability to manage our business effectively.
Our ability to achieve our investment objective will depend on our ability to manage our business and to grow our investments and earnings. This will depend, in turn, on our Investment Advisor’s ability to identify, invest in and monitor portfolio companies that meet our investment criteria. The achievement of our investment objectives on a cost-effective basis will depend upon our Investment Advisor’s execution of our investment process, its ability to provide competent, attentive and efficient services to us and, to a lesser extent, our access to financing on acceptable terms. Any failure to manage our business and our future growth effectively could have a material adverse effect on our business, financial condition, results of operations and cash flows.
Our executive officers and directors, our Investment Advisor, PSCM and their affiliates, officers, directors and employees may face certain conflicts of interest.
The employees of PSCM and our Investment Advisor serve, or may serve, as officers, directors, members, or principals of entities that operate in the same or a related line of business as we do, or of investment funds, accounts, or investment vehicles managed by it and/or its affiliates. Similarly, PSCM, the Investment Advisor and their affiliates may have other clients with similar, different or competing investment objectives.
In serving in these multiple capacities, they may have obligations to other clients or investors in those entities, the fulfillment of which may not be in the best interests of us or our stockholders. There is a potential that we will compete with these clients, and other entities managed by the Investment Advisor and its affiliates, for capital and investment opportunities. As a result, the Investment Advisor and, as applicable, the members of the Investment Committee may face conflicts in the allocation of investment opportunities among us and the investment funds, accounts and investment vehicles managed by the Investment Advisor and its affiliates. Our Investment Advisor intends to allocate investment opportunities among eligible investment funds, accounts and investment vehicles in a manner that is fair and equitable over time and consistent with its allocation policy. However, we can offer no assurance that such opportunities will be allocated to us fairly or equitably in the short-term or over time.
Our Investment Advisor or its affiliates may, from time to time, possess material non-public information, limiting our investment discretion.
Principals and other employees of our Investment Advisor, including members of the Investment Advisor’s Investment Committee, may serve as directors of, or in a similar capacity with, portfolio companies in which we invest, the securities of which are purchased or sold on our behalf. In the event that material non-public information is obtained with respect to such companies, or we become subject to trading restrictions under the internal trading policies of those companies or as a result of applicable law or regulations, we could be prohibited for a period of time from purchasing or selling the securities of such companies, and this prohibition may have an adverse effect on us.
Our management and incentive fee structure with our Investment Advisor may create incentives for our Investment Advisor that are not fully aligned with the interests of our stockholders and may induce our Investment Advisor to make speculative investments.
In the course of our investing activities, we pay management and incentive fees to the Investment Advisor. We have entered into an Advisory Agreement with the Investment Advisor. Under the incentive fee structure, our adjusted net investment income for purposes thereof is computed and paid on income that may include interest income that has been accrued but not yet received in cash. This fee structure may give rise to a conflict of interest for the Investment Advisor to the extent that it encourages the Investment Advisor to favor debt financings that provide for deferred interest, rather than current cash payments of interest. The Investment Advisor may have an incentive to invest in deferred interest securities in circumstances where it would not have done so but for the opportunity to continue to earn the Income Incentive Fee even when the issuers of the deferred interest securities would not be able to make actual cash payments to us on such securities. This risk could be increased because, under our Advisory Agreement, the Investment Advisor is not obligated to reimburse us for incentive fees it receives even if we subsequently incur losses or never receive in cash the deferred income that was previously accrued.
The valuation process for certain of our portfolio holdings may create a conflict of interest.
We may make portfolio investments in the form of loans and securities that are not publicly traded and for which no market based price quotation is available. Effective August 11, 2022, our Board designated the Investment Advisor as our valuation designee. The participation of the Investment Advisor’s investment professionals in our valuation process could result in a conflict of interest as the Investment Advisor’s base management fee is based, in part, on the value of our total net assets.
25
We operate in a highly competitive market for investment opportunities, which could reduce returns and result in losses.
The business of investing in assets meeting our investment objective is highly competitive. Competition for investment opportunities includes a growing number of nontraditional participants, such as hedge funds, senior private debt funds, including BDCs, and other private investors, as well as more traditional lending institutions and competitors. Some of these competitors may have access to greater amounts of capital or may have different return thresholds than us, and thus these competitors may have advantages not shared by us. Furthermore, many of our competitors are not subject to the regulatory restrictions that the 1940 Act imposes on us as a BDC or the source-of-income, asset diversification and distribution requirements we must satisfy to qualify and maintain our RIC status. Increased competition for, or a diminishment in the available supply of, investments suitable for us could result in lower returns on such investments. Moreover, the identification of attractive investment opportunities is difficult and involves a high degree of uncertainty. We may incur significant expenses in connection with identifying investment opportunities and investigating other potential investments which are ultimately not consummated, including expenses relating to due diligence, transportation, legal expenses and the fees of other third party advisors.
With respect to the investments we make, we will not seek to compete based primarily on the interest rates we will offer, and we believe that some of our competitors may make loans with interest rates that will be lower than the rates we offer. In the secondary market for acquiring existing loans, we expect to compete generally on the basis of pricing terms. With respect to all investments, we may lose some investment opportunities if we do not match our competitors’ pricing, terms and structure. However, if we match our competitors’ pricing, terms and structure, we may experience decreased net interest income, lower yields and increased risk of credit loss.
We may need to raise additional capital.
We may need to raise additional capital to fund new investments and grow our portfolio of investments. We intend to access the capital markets periodically to issue debt or equity securities or borrow from financial institutions in order to obtain such additional capital. Unfavorable economic conditions could increase our funding costs, limit our access to the capital markets or result in a decision by lenders not to extend credit to us. A reduction in the availability of new capital could limit our ability to grow. In addition, we are required to distribute dividends for U.S. federal income tax purposes of an amount generally at least equally to 90% of the sum of our net ordinary income and net short-term capital gains in excess of net long-term capital losses, if any, to our stockholders to qualify and maintain our RIC status. As a result, these earnings will not be available to fund new investments. An inability on our part to access the capital markets successfully could limit our ability to grow our business and execute our business strategy fully and could decrease our earnings, if any, which would have an adverse effect on the value of our securities.
Our investments in PIK interest income may expose us to risks, including a possible increase in incentive fees that are payable by us to the Investment Advisor.
Certain of our debt investments may contain provisions providing for the payment of PIK interest. Because PIK interest results in an increase in the size of the loan balance of the underlying loan, the receipt by us of PIK interest will have the effect of increasing our total net assets. As a result, because the base management fee that we pay to the Investment Advisor is based on the value of our total net assets, the receipt by us of PIK interest will result in an increase in the amount of the base management fee payable by us. In addition, any such increase in a loan balance due to the receipt of PIK interest will cause such loan to accrue interest on the higher loan balance, which will result in an increase in our pre-incentive fee net investment income and, as a result, an increase in incentive fees that are payable by us to the Investment Advisor.
Our strategy involves a high degree of leverage. We intend to continue to finance our investments with borrowed money, which will magnify the potential for gain or loss on amounts invested and may increase the risk of investing in us.
The use of leverage magnifies the potential for gain or loss on amounts invested. The use of leverage is generally considered a speculative investment technique and increases the risks associated with investing in our securities. We have borrowed and intend to continue to borrow from, and may in the future issue debt securities to, banks, insurance companies and other lenders. Lenders of these funds will have fixed dollar claims on our assets that are superior to the claims of our common stockholders, and we would expect such lenders to seek recovery against our assets in the event of a default. We may pledge up to 100% of our assets and may grant a security interest in all of our assets under the terms of any debt instruments we may enter into with lenders. If the value of our assets decreases, leveraging would cause net asset value to decline more sharply than it otherwise would have had we not leveraged, thereby magnifying losses or eliminating our stake in a leveraged investment. Similarly, any decrease in our revenue or income will cause our net income to decline more sharply than it would have had we not borrowed. Such a decline would also negatively affect our ability to make dividend payments on our common stock. Our ability to service any debt will depend largely on our financial performance and will be subject to prevailing economic conditions and competitive pressures. In addition, our common stockholders will bear the burden of any increase in our expenses as a result of our use of leverage, including interest expenses.
As a BDC, we generally are required to meet a coverage ratio of total assets to total borrowings and other senior securities, which include all of our borrowings and any preferred stock that we may issue in the future, of at least 150%. If this ratio declines below 150%, we will not be able to incur additional debt when it is otherwise advantageous or necessary for us to do so. The amount of leverage that we employ will depend on the Investment Advisor’s and our Board’s assessment of market and other factors at the time of any proposed borrowing. We cannot assure you that we will be able to obtain credit at all or on terms acceptable to us.
26
Illustration
The following table illustrates the effect of leverage on returns from an investment in our common stock assuming various annual returns, net of expenses. The calculations in the table below are hypothetical and actual results may be higher or lower than those appearing below.
Assumed Return on Our Portfolio(1)
(net of expenses)
|
|
|
(10.0 |
)% |
|
|
(5.0 |
)% |
|
|
0.0 |
% |
|
|
5.0 |
% |
|
|
10.0 |
% |
Corresponding net return to common stockholder |
|
|
( |
)% |
|
|
( |
)% |
|
|
( |
)% |
|
|
% |
|
|
% |
Based on outstanding indebtedness of $804.2 million as of December 31, 2024, and the weighted average effective interest rate of 6.82%, our investment portfolio would have had to produce an annual return of approximately 3.90% to cover annual interest payments on outstanding debt.
We are subject to various covenants under our credit facilities which, if not complied with, could result in reduced availability and/or mandatory prepayments under our credit facilities.
We are subject to various covenants under our credit facilities which, if not complied with, could result in reduced availability and/or mandatory prepayments under our credit facilities. In the event we default under our credit facilities or any other future borrowing facility, our business could be adversely affected as we may be forced to sell a portion of our investments quickly and prematurely at what may be disadvantageous prices to us in order to meet our outstanding payment obligations and/or support working capital requirements under our credit facilities, or such future borrowing facility, any of which would have a material adverse effect on our business, financial condition, results of operations and cash flows. In addition, following any such default, the agent for the lenders under our credit facilities, or such future borrowing facility could assume control of the disposition of any or all of our assets, including the selection of such assets to be disposed and the timing of such disposition, which would have a material adverse effect on our business, financial condition, results of operations and cash flows.
In addition to asset coverage ratio requirements, our credit facilities contain various covenants which, if not complied with, could accelerate repayment of the indebtedness under our credit facilities. This could have a material adverse effect on our business, financial condition and results of operations. Our borrowings under the BoA Credit Facility are collateralized by the assets in a special purpose wholly-owned subsidiary, PS BDC Funding. The agreements governing the BoA Credit Facility require us to comply with certain financial and operational covenants. These covenants include a requirement to maintain a first-prior security interest in the collateral for the benefit of the lenders under the BoA Credit Facility, maintain various policies and procedures, and maintain a minimum borrowing base under the BoA Credit Facility. Our borrowings under the line of credit provided to us under the WF Credit Facility are collateralized by the assets in a special purpose wholly owned subsidiary, PS BDC Funding II. The agreements governing the WF Credit Facility require us to comply with certain financial and operational covenants. These covenants include a requirement to maintain a first-prior security interest in the collateral for the benefit of the lenders under the WF Credit Facility, maintain various policies and procedures, and maintain a minimum borrowing base under the WF Credit Facility. Our continued compliance with the covenants under our credit facilities depends on many factors, some of which are beyond our control.
Changes in interest rates may affect our cost of capital and net investment income.
Because we borrow money to make investments, our net investment income will depend, in part, upon the difference between the rate at which we borrow funds and the rate at which we invest those funds. As a result, we can offer no assurance that a significant change in market interest rates would not have a material adverse effect on our net investment income given that we use debt to finance our investments. In periods of rising interest rates, our cost of funds could increase, which could reduce our net investment income. In addition, in a prolonged low interest rate environment, the difference between investment income earned on interest earning assets and the interest expense incurred on interest bearing liabilities may be compressed, reducing our net investment income and potentially adversely affecting our operating results. We may use interest rate risk management techniques in an effort to limit our exposure to interest rate fluctuations. Such techniques may include various interest rate hedging activities to the extent permitted by the 1940 Act.
27
We may have uncertainty as to the value of certain portfolio investments.
We expect that certain of our portfolio investments may take the form of securities that are not publicly traded. The fair value of loans, securities and other investments that are not publicly traded may not be readily determinable and we will value these investments at fair value as determined in good faith by the Investment Advisor (subject to the Board’s oversight). Certain of our investments (other than cash and cash equivalents) will be classified as Level 2 assets under Topic 820 of the U.S. Financial Accounting Standards Board’s Accounting Standards Codification (“ASC”), as amended, Fair Value Measurements and Disclosures (“ASC 820”). This means that certain of our portfolio valuations will be based on inputs other than quoted prices which are either directly or indirectly observable, such as quoted prices for similar assets or liabilities in active markets, quoted prices for identical or similar assets or liabilities in non-active markets including actionable bids from third parties for privately held assets or liabilities, and observable inputs other than quoted prices such as yield curves and forward currency rates that are entered directly into valuation models to determine the value of derivatives or other assets or liabilities. Certain other of our investments may be classified as Level 3 under ASC 820, which means that certain of our portfolio valuations will be based on unobservable inputs and our own assumptions about how market participants would price the asset or liability in question. We expect that inputs into the determination of fair value of our portfolio investments will require significant management judgment or estimation. Even if observable market data are available, such information may be the result of consensus pricing information or broker quotes, which include a disclaimer that the broker would not be held to such a price in an actual transaction. The non-binding nature of consensus pricing and/or quotes accompanied by disclaimers materially reduces the reliability of such information. The types of factors that the Board may take into account in determining the fair value of our investments generally include, as appropriate, comparison to publicly-traded securities including such factors as yield, maturity and measures of credit quality, the enterprise value of a portfolio company, the nature and realizable value of any collateral, the portfolio company’s ability to make payments and its earnings and discounted cash flow, the markets in which the portfolio company does business and other relevant factors. Because such valuations, and particularly valuations of private securities and private companies, are inherently uncertain, may fluctuate over short periods of time and may be based on estimates, our determinations of fair value may differ materially from the values that would have been used if a ready market for these loans and securities existed. Our net asset value could be adversely affected if our determinations regarding the fair value of our investments were materially higher than the values that we ultimately realize upon the disposal of such loans and securities. In addition, the method of calculating the base management fee may result in conflicts of interest between the Investment Advisor, on the one hand, and our stockholders on the other hand, with respect to valuation of investments.
We will adjust on a quarterly basis the valuation of our portfolio to reflect the Investment Advisor’s determination (subject to the Board’s oversight) of the fair value of each investment in our portfolio for which market quotes are not readily available. Any changes in fair value are recorded in our statements of operations as net change in unrealized appreciation or depreciation on investments.
We may experience fluctuations in our quarterly operating results.
We could experience fluctuations in our quarterly operating results due to a number of factors, including the interest rate payable on the loans and debt securities we acquire, the default rate on such loans and securities, the level of our expenses, variations in and the timing of the recognition of realized and unrealized gains or losses, the degree to which we encounter competition in our markets and general economic conditions. Moreover, as of December 31, 2024, 100% of our investments were classified as Level 1 or Level 2, which may cause our NAV to experience greater fluctuations than funds with a greater proportion of Level 3 assets. In light of these factors, results for any period should not be relied upon as being indicative of performance in future periods.
The Board may change our investment objectives, operating policies and strategies without prior notice or stockholder approval.
The Board has the authority, except as otherwise provided in the 1940 Act, to modify or waive certain of our operating policies and strategies without prior notice and without stockholder approval. We cannot predict the effect any changes to our current operating policies and strategies would have on our business, operating results and the market price of our common stock. Nevertheless, any such changes could adversely affect our business and impair our ability to make distributions to our stockholders.
We are subject to risks related to our management of ESG activities.
Our business faces increasing public scrutiny related to ESG activities. We risk damage to our brand and reputation if we fail to act responsibly in a number of areas, such as environmental stewardship, corporate governance and transparency and considering ESG factors in our investment processes. Adverse incidents with respect to ESG activities could impact the value of our brand, the cost of our operations and relationships with investors, all of which could adversely affect our business and results of operations. Additionally, new regulatory initiatives related to ESG could adversely affect our business.
Our Investment Advisor and Administrator each have the ability to resign on 60 days’ notice, and we may not be able to find a suitable replacement within that time, resulting in a disruption in our operations that could adversely affect our financial condition, business and results of operations.
The Investment Advisor has the right under the Advisory Agreement to resign as our Investment Advisor at any time upon not less than 60 days’ written notice, whether we have found a replacement or not. Similarly, our Administrator has the right under the Administration Agreement to resign at any time upon not less than 60 days’ written notice, whether we have found a replacement or not. If the Investment Advisor or Administrator were to resign, we may not be able to find a new investment adviser or administrator, as applicable, or hire internal management with similar expertise and ability to provide the same or equivalent services on acceptable terms within 60 days, or at all. If we are unable to do so quickly, our operations are likely to experience a disruption, our financial condition, business and results of operations as well as our ability to pay distributions to our stockholders are likely to be adversely affected.
Moreover, pursuant to the Resource Sharing Agreement, PSCM provides the Investment Advisor with experienced investment professionals and services so as to enable the Investment Advisor to fulfill its obligations under the Advisory Agreement, and such Resource Sharing Agreement may itself be terminated on 60 days’ notice. If PSCM were to so terminate the Resource Sharing Agreement, the Investment Advisor may be required to seek to find an alternate means of fulfilling its obligations under the Advisory Agreement, or to resign.
28
We are highly dependent on information systems, and systems failures or cyber-attacks could significantly disrupt our business, which may, in turn, negatively affect the value of shares of our common stock and our ability to pay distributions.
Our business relies on secure information technology systems. These systems are exposed to operational and information security risks resulting from cyberattacks that threaten the confidentiality, integrity or availability of our information resources (i.e., cyber incidents). Cyber incidents can result from unintentional events (such as an inadvertent release of confidential information) or deliberate attacks by insiders or third parties. These attacks could involve gaining unauthorized access to our information systems for purposes of misappropriating assets, stealing and unauthorized release of confidential information, corrupting data, denial of service attacks on our websites, “ransomware” that renders systems inoperable until ransom is paid, or various other forms of cybersecurity breaches. Cybersecurity incidents and cyber-attacks have been occurring more frequently and will likely continue to increase. Such cyber incidents could result in disrupted operations, misstated or unreliable financial data, liability for stolen assets or information, increased cybersecurity protection and insurance costs, litigation and damage to our business relationships, any of which could have a material adverse effect on our business, financial condition and results of operations. As our reliance on technology has increased, so have the risks posed to our information systems, both internal and those provided by the Investment Advisor and third-party service providers. Cyber incidents affecting us, our Investment Advisor, or third-party service providers may adversely impact us or the companies in which we invest, causing our investments to lose value. We, along with our Investment Advisor, have implemented processes, procedures and internal controls to help mitigate cybersecurity risks and cyber intrusions. However, these measures may not be effective, and there can be no assurance that a cyber incident will not occur or that our financial results, operations or confidential information will not be negatively impacted by such an incident. In addition, the costs related to cyber or other security threats or disruptions may not be fully insured or indemnified by other means, and we may be required to expend additional resources to modify our protective measures and to investigate and remediate vulnerabilities or other exposures arising from operational and security risks. Furthermore, cybersecurity continues to be a key priority for regulators around the world, and some jurisdictions have enacted laws requiring companies to notify individuals or the general investing public of data security breaches involving certain types of personal data, including the SEC, which, on July 26, 2023, adopted amendments requiring the prompt public disclosure of certain cybersecurity breaches. If we fail to comply with the relevant laws and regulations, we could suffer financial losses, a disruption of our businesses, liability to investors, regulatory intervention or reputational damage.
We are subject to risks associated with artificial intelligence and machine learning technology.
Artificial intelligence, including machine learning and similar tools and technologies that collect, aggregate, analyze or generate data or other materials, or collectively, AI, and its current and potential future applications including in the private investment and financial industries, as well as the legal and regulatory frameworks within which AI operates, continue to rapidly evolve.
Recent technological advances in AI pose risks to the Company, the Investment Advisor, and our portfolio companies. The Company and our portfolio companies could also be exposed to the risks of AI if third-party service providers or any counterparties, whether or not known to the Company, also use AI in their business activities. We and our portfolio companies may not be in a position to control the use of AI technology in third-party products or services.
Use of AI could include the input of confidential information in contravention of applicable policies, contractual or other obligations or restrictions, resulting in such confidential information becoming partly accessible by other third-party AI applications and users. While the Investment Advisor does not currently use AI to make investment recommendations, the use of AI could also exacerbate or create new and unpredictable risks to our business, the Investment Advisor’s business, and the business of our portfolio companies, including by potentially significantly disrupting the markets in which we and our portfolio companies operate or subjecting us, our portfolio companies and the Investment Advisor to increased competition and regulation, which could materially and adversely affect business, financial condition or results of operations of us, our portfolio companies and the Investment Advisor. In addition, the use of AI by bad actors could heighten the sophistication and effectiveness of cyber and security attacks experienced by our portfolio companies and the Investment Adviser.
Independent of its context of use, AI technology is generally highly reliant on the collection and analysis of large amounts of data, and it is not possible or practicable to incorporate all relevant data into the model that AI technology utilizes to operate. Certain data in such models will inevitably contain a degree of inaccuracy and error and could otherwise be inadequate or flawed, which would be likely to degrade the effectiveness of AI technology. To the extent that we or our portfolio companies are exposed to the risks of AI use, any such inaccuracies or errors could have adverse impacts on the Company or our investments.
AI technology and its applications, including in the private investment and financial sectors, continue to develop rapidly, and it is impossible to predict the future risks that may arise from such developments.
Failure to maintain our status as a business development company would reduce our operating flexibility.
If we do not maintain our status as a business development company, we might be regulated as a closed-end investment company under the 1940 Act, which would subject us to substantially more regulatory restrictions and correspondingly decrease our operating flexibility.
29
Our charter includes an exclusive forum selection provision, which could limit our stockholders’ ability to obtain a favorable judicial forum for disputes with us or our directors, officers, or other agents.
Our charter provides that, unless we consent in writing to the selection of a different forum, (i) the Circuit Court for Baltimore City, Maryland, or, if that court does not have jurisdiction, the United States District Court for the District of Maryland, Baltimore Division, shall be, except for any claims made under the federal U.S. securities laws, the sole and exclusive forum for (a) any derivative action or proceeding brought on behalf of the Company, (b) any action asserting a claim of breach of any duty owed by a director or officer or other employee of the Company to the Company or to the stockholders of the Company or asserting a claim of breach of any standard of conduct set forth in the Maryland General Corporation Law, or the “MGCL”, (c) any action asserting a claim against the Company or any director or officer or other employee of the Company arising pursuant to any provision of the MGCL, the charter or our bylaws, or (d) any action asserting a claim against the Company or any director or officer or other employee of the Company that is governed by the internal affairs doctrine. and (ii) the federal district courts of the United States of America shall be the sole and exclusive forum for any claims, suits, actions or proceedings arising under the federal securities laws. In addition, this provision may increase costs for shareholders in bringing a claim against us or our directors, officers or other agents. Any person or entity purchasing or otherwise acquiring any interest in shares of our capital stock will be deemed, to the fullest extent permitted by law, to have notice of and consented to these exclusive forum provisions. The exclusive forum selection provision in our charter may limit our stockholders’ ability to obtain a favorable judicial forum for disputes with us or our directors, officers or other agents, which may discourage lawsuits against us and such persons. It is also possible that, notwithstanding such exclusive forum selection provision, a court could rule that such provision is inapplicable or unenforceable. If this occurred, we may incur additional costs associated with resolving such action in another forum, which could materially adversely affect our business, financial condition and results of operations.
We have a limited operating history.
We began operations on January 23, 2020 and have a limited operating history. As a result, we are subject to all of the business risks and uncertainties associated with any new business, including the risk that it will not achieve its investment objectives and that the value of your investment could decline substantially or that the investor will suffer a complete loss of its investment in us.
In addition, neither PSCM (including the employees of PSCM that serve on the Investment Team) nor the Investment Advisor has managed a BDC prior to our inception. The 1940 Act imposes numerous constraints on the operations of BDCs that generally do not apply to other investment vehicles managed by PSCM. BDCs are required, for example, to invest at least 70% of their total assets primarily in securities of U.S. private or thinly traded public companies, cash, cash equivalents, U.S. government securities and other high-quality debt instruments that mature in one year or less from the date of investment. We, the Investment Advisor and PSCM have limited experience operating or advising under these constraints, which may hinder our ability to take advantage of attractive investment opportunities and to achieve our investment objective.
Risks Related to the 1940 Act
Our ability to enter into transactions with our affiliates is restricted.
The 1940 Act prohibits or restricts our ability to engage in certain principal transactions and joint transactions with certain “First Tier” affiliates and “Second Tier” affiliates. For example, we are prohibited from buying or selling any security from or to any person who owns more than 25% of our voting securities or certain of that person’s affiliates (each is a “First Tier” affiliate), or entering into prohibited joint transactions with such persons, absent the prior approval of the SEC. We consider the Investment Advisor and its affiliates, including PSCM, to be “First Tier” affiliates for such purposes. We are prohibited under the 1940 Act from participating in certain principal transactions and joint transactions with a “Second Tier” affiliate without the prior approval of our Independent Directors. Any person that owns, directly or indirectly, 5% or more of our outstanding voting securities will be a “Second Tier” affiliate for purposes of the 1940 Act, and we are generally prohibited from buying or selling any security from or to such affiliate without the prior approval of our Independent Directors.
We may, however, invest alongside PSCM’s investment funds, accounts and investment vehicles in certain circumstances where doing so is consistent with our investment strategy as well as applicable law and SEC staff interpretations. For example, we may invest alongside such investment funds, accounts and investment vehicles consistent with guidance promulgated by the SEC staff to purchase interests in a single class of privately placed securities so long as certain conditions are met, including that the Investment Advisor and PSCM, acting on our behalf and on behalf of such investment funds, accounts and investment vehicles, negotiate no term other than price.
In situations where co-investment with investment funds, accounts and investment vehicles managed by the Investment Advisor and its affiliates, including PSCM, is not permitted or appropriate, such as when there is an opportunity to invest in different securities of the same issuer or where the different investments could be expected to result in a conflict between our interests and those of these other clients, the Investment Advisor and PSCM will need to decide which client will proceed with the investment. These restrictions will limit the scope of investment opportunities that would otherwise be available to us.
We, the Investment Advisor and PSCM have been granted exemptive relief from the SEC to permit greater flexibility to negotiate the terms of co-investments if our Board determines that it would be advantageous for us to co-invest with investment funds, accounts and investment vehicles managed by PSCM in a manner consistent with our investment objectives, positions, policies, strategies and restrictions as well as regulatory requirements and other pertinent factors. We believe that co-investment by us and investment funds, accounts and investment vehicles managed by the Investment Advisor and its affiliates, including PSCM, may afford us additional investment opportunities and an ability to achieve greater diversification. Accordingly, our exemptive order permits us to invest with these investment funds, accounts and investment vehicles managed in the same portfolio companies under circumstances in which such investments would otherwise not be permitted by the 1940 Act. Our exemptive relief permitting co-investments applies only if our Independent Directors review and approve each co-investment. The exemptive order imposes other constraints on co-investments that limit the number of instances when we may rely on its protections.
30
Regulations governing our operation as a BDC affect our ability to, and the way in which we, raise additional capital.
Regulations governing our operation as a BDC affect our ability to raise, and the way in which we raise, additional capital or borrow for investment purposes, which may have a negative impact on our growth. We may issue debt securities or preferred stock and/or borrow money from banks or other financial institutions, which we refer to collectively as “senior securities,” up to the maximum amount permitted by the 1940 Act. We are generally able to issue senior securities such that our asset coverage, as defined in the 1940 Act, equals at least 150% of gross assets less all liabilities and indebtedness not represented by senior securities, after each issuance of senior securities. If the value of our assets decline, we may be unable to satisfy this test. If that happens, we may be required to sell a portion of our investments at a time when such sales may be disadvantageous to use in order to repay a portion of our indebtedness.
Risks Related to our Investments
Economic recessions or downturns could impair our portfolio companies, and defaults by our portfolio companies will harm our operating results.
Many of the portfolio companies in which we have invested or expect to make investments are likely to be susceptible to economic slowdowns or recessions and may be unable to repay our loans during such periods. Therefore, the number of our non-performing assets is likely to increase, and the value of our portfolio is likely to decrease during such periods. Adverse economic conditions may decrease the value of collateral securing some of our loans and debt securities and the value of our equity investments. Economic slowdowns or recessions could lead to financial losses in our portfolio and a decrease in revenues, net income and assets. Unfavorable economic conditions also could increase our funding costs, limit our access to the capital markets or result in a decision by lenders not to extend credit to us. These events could prevent us from increasing our investments and harm our operating results.
A portfolio company’s failure to satisfy financial or operating covenants imposed by us or other lenders could lead to defaults and, potentially, termination of its loans and foreclosure on its assets, which could trigger cross-defaults under other agreements and jeopardize our portfolio company’s ability to meet its obligations under the loans and debt securities that we hold. We may incur expenses to the extent necessary to seek recovery upon default or to negotiate new terms with a defaulting portfolio company.
We may hold the debt securities of leveraged portfolio companies.
Portfolio companies may issue certain types of debt, such as senior loans, mezzanine or high yield in connection with leveraged acquisitions or recapitalizations in which the portfolio company incurs a substantially higher amount of indebtedness than the level at which it had previously operated. Leverage may have important consequences to these portfolio companies and us as an investor. For example, the substantial indebtedness of a portfolio company could (i) limit its ability to borrow money for its working capital, capital expenditures, debt service requirements, strategic initiatives or other purposes; (ii) require it to dedicate a substantial portion of its cash flow from operations to the repayment of its indebtedness, thereby reducing funds available to it for other purposes; (iii) make it more highly leveraged than some of its competitors, which may place it at a competitive disadvantage; or (iv) subject it to restrictive financial and operating covenants, which may preclude it from favorable business activities or the financing of future operations or other capital needs.
A leveraged portfolio company’s income and net assets will tend to increase or decrease at a greater rate than if borrowed money were not used. In addition, a portfolio company with a leveraged capital structure will be subject to increased exposure to adverse economic factors, such as a significant rise in interest rates, a severe downturn in the economy or deterioration in the condition of that portfolio company or its industry. If a portfolio company is unable to generate sufficient cash flow to meet all of its obligations, it may take alternative measures (e.g., reduce or delay capital expenditures, sell assets, seek additional capital, or seek to restructure, extend or refinance indebtedness). These actions may negatively affect our investment in such a portfolio company.
Investment in leveraged companies involves a number of significant risks. Leveraged companies in which we invest may have limited financial resources and may be unable to meet their obligations under their loans and debt securities that we hold. Such developments may be accompanied by a deterioration in the value of any collateral and a reduction in the likelihood of our realizing any guarantees that we may have obtained in connection with our investment. Smaller leveraged companies also may have less predictable operating results and may require substantial additional capital to support their operations, finance their expansion or maintain their competitive position.
Our investments in secured loans may nonetheless expose us to losses from default and foreclosure.
While we invest in secured loans, they may nonetheless be exposed to losses resulting from default and foreclosure. Therefore, the value of the underlying collateral, the creditworthiness of the borrower and the priority of the lien are each of great importance. We cannot guarantee the adequacy of the protection of our interests, including the validity or enforceability of the loan and the maintenance of the anticipated priority and perfection of the applicable security interests. Furthermore, we cannot assure you that claims may not be asserted that might interfere with enforcement of our rights. In addition, in the event of any default under a secured loan held directly by us, we will bear a risk of loss of principal to the extent of any deficiency between the value of the collateral and the principal and accrued interest of the secured loan, which could have a material adverse effect on our cash flow from operations.
In the event of a foreclosure, we may assume direct ownership of the underlying asset. The liquidation proceeds upon sale of such asset may not satisfy the entire outstanding balance of principal and interest on the loan, resulting in a loss to us. Any costs or delays involved in the effectuation of a foreclosure of the loan or a liquidation of the underlying property will further reduce the proceeds and thus increase the loss.
31
Our investments in mezzanine debt and other junior securities are subordinate to senior indebtedness of the applicable company and are subject to greater risk.
The mezzanine debt and other junior investments in which we may invest are typically contractually or structurally subordinated to senior indebtedness of the applicable company, or effectively subordinated as a result of being unsecured debt and therefore subject to the prior repayment of secured indebtedness to the extent of the value of the assets pledged as security. In some cases, the subordinated debt held by us may be subject to the prior repayment of different classes of senior debt that may be in priority ahead of the debt held by us. In the event of financial difficulty on the part of a portfolio company, such class or classes of senior indebtedness ranking prior to the debt held by us, and interest thereon and related expenses, must first be repaid in full before any recovery may be had on our mezzanine debt or other subordinated investments. Subordinated investments are characterized by greater credit risks than those associated with the senior or senior secured obligations of the same issuer. In addition, under certain circumstances the holders of the senior indebtedness will have the right to block the payment of interest and principal on our mezzanine debt or other junior investment and to prevent us from pursuing its remedies on account of such non-payment against the issuer. Further, in the event of any debt restructuring or workout of the indebtedness of any issuer, the holders of the senior indebtedness will likely control the creditor side of such negotiations.
Many issuers of mezzanine debt or other junior securities are highly leveraged, and their relatively high debt-to-equity ratios create increased risks that their operations might not generate sufficient cash flow to service their debt obligations. In addition, many issuers of mezzanine debt or other junior securities may be in poor financial condition, experiencing poor operating results, having substantial capital needs or negative net worth or be facing special competitive or product obsolescence problems, and may include companies involved in bankruptcy or other reorganizations or liquidation proceedings. Adverse changes in the financial condition of an issuer, general economic conditions, or both, may impair the ability of such issuer to make payments on the subordinated securities and result in defaults on such securities more quickly than in the case of the senior obligations of such issuer. Mezzanine debt and other junior securities may not be publicly traded, and therefore it may be difficult to obtain information as to the true condition of the issuers. Finally, the market values of certain of mezzanine debt and other junior securities may reflect individual corporate developments.
Our investments include Covenant-Lite Loans, which give us fewer rights and subject us to greater risk of loss than loans with financial maintenance covenants.
A significant number of high yield loans in the market, in particular the broadly syndicated loan market, consist of Covenant-Lite Loans, which are loans that do not require the borrower to maintain debt service or other financial ratios and do not include terms which allow the lender to monitor the performance of the borrower and declare a default if certain criteria are breached. A significant portion of the loans in which we may invest or get exposure to through its investments in CDOs or other types of structured securities are Covenant-Lite Loans and it is possible that such loans may comprise a majority of our portfolio from time to time. Ownership of Covenant-Lite Loans exposes us to different risks, including with respect to liquidity, price volatility, ability to restructure loans, credit risks and less protective loan documentation, than is the case with loans that contain financial maintenance covenants. Generally, Covenant-Lite Loans provide borrower companies more freedom to negatively impact lenders because their covenants are incurrence-based, which means they are only tested and can only be breached following an affirmative action of the borrower, rather than by a deterioration in the borrower’s financial condition. Accordingly, to the extent we invest in Covenant-Lite Loans, we may have fewer rights against a borrower and may have a greater risk of loss on such investments as compared to investments in or exposure to loans with financial maintenance covenants.
Our prospective portfolio companies may prepay loans, which may reduce our yields if capital returned cannot be invested in transactions with equal or greater expected yields.
The terms of loans we acquire or originate may be subject to early prepayment options or similar provisions which, in each case, could result in us realizing repayments of such loans earlier than expected, sometimes with no or a nominal prepayment premium. This may happen when there is a decline in interest rates, when the portfolio company’s improved credit or operating or financial performance allows the refinancing of certain classes of debt with lower cost debt or when the general credit market conditions improve. Additionally, prepayments could negatively impact our ability to pay, or the amount of, distributions on our common stock, which could result in a decline in the market price of our shares. Our inability to reinvest such proceeds may materially affect the overall performance.
We invest in high yield debt, which has greater credit and liquidity risk than more highly rated debt obligations.
We invest in high yield debt, a substantial portion of which may be rated below investment-grade by one or more nationally recognized statistical rating organizations or is unrated but of comparable credit quality to obligations rated below investment-grade, and has greater credit and liquidity risk than more highly rated debt obligations. High yield debt is generally unsecured and may be subordinate to other obligations of the obligor. The lower rating of high yield debt reflect a greater possibility that adverse changes in the financial condition of the obligor or in general economic conditions (including, for example, a substantial period of rising interest rates or declining earnings) or both may impair the ability of the obligor to make payment of principal and interest. Many issuers of high yield debt are highly leveraged, and their relatively high debt-to-equity ratios create increased risks that their operations might not generate sufficient cash flow to service their debt obligations. In addition, many issuers of high yield debt may be in poor financial condition, experiencing poor operating results, having substantial capital needs or negative net worth or be facing special competitive or product obsolescence problems, and may include companies involved in bankruptcy or other reorganizations or liquidation proceedings. Certain of these securities may not be publicly traded, and therefore it may be difficult to obtain information as to the true condition of the issuers. Overall declines in the below investment-grade bond and other markets may adversely affect such issuers by inhibiting their ability to refinance their debt at maturity. High yield debt is often less liquid than higher rated securities, and the market for high yield debt has recently experienced periods of volatility. The market values of certain of this high yield debt may reflect individual corporate developments.
32
Our investments in bank loans and financial institutions may be less liquid than our other investments and we may incur greater risk with respect to investments we acquire through assignments or participations of interests.
We may invest a portion of our investments in loans originated by banks and other financial institutions. The loans invested in by us may include term loans and revolving loans, may pay interest at a fixed or floating rate and may be senior or subordinated. Purchasers of bank loans are predominantly commercial banks, investment funds and investment banks. As secondary market trading volumes for bank loans increase, new bank loans are frequently adopting standardized documentation to facilitate loan trading, which should improve market liquidity. There can be no assurance, however, that future levels of supply and demand in bank loan trading will provide an adequate degree of liquidity, that the current period of illiquidity will not persist or worsen and that the market will not experience periods of significant illiquidity in the future. In addition, we may make investments in stressed or distressed bank loans, which are often less liquid than performing bank loans.
Compared to securities and to certain other types of financial assets, purchases and sales of loans take relatively longer to settle. This extended settlement process can (i) increase the counterparty credit risk borne by us; (ii) leave us unable to timely vote, or otherwise act with respect to, loans we have agreed to purchase; (iii) delay us from realizing the proceeds of a sale of a loan; (iv) inhibit our ability to re-sell a loan that it has agreed to purchase if conditions change (leaving us more exposed to price fluctuations); (v) prevent us from timely collecting principal and interest payments; and (vi) expose us to adverse tax or regulatory consequences. To the extent the extended loan settlement process gives rise to short-term liquidity needs, we may hold cash, sell investments or temporarily borrow from banks or other lenders.
In certain circumstances, loans may not be deemed to be securities, and in the event of fraud or misrepresentation by a borrower or an arranger, lenders will not have the protection of the anti-fraud provisions of the federal securities laws, as would be the case for bonds or stocks. Instead, in such cases, lenders generally rely on the contractual provisions in the loan agreement itself, and common-law fraud protections under applicable state law.
We may acquire interests in bank loans either directly (by way of sale or assignment) or indirectly (by way of participation). The purchaser of an assignment typically succeeds to all the rights and obligations of the assigning institution and becomes a lender under the credit agreement with respect to the debt obligation; however, its rights can be more restricted than those of the assigning institution. Participation interests in a portion of a debt obligation typically result in a contractual relationship only with the institution participating out the interest, and not with the borrower. In purchasing participations, we generally will have no right to enforce compliance by the borrower with the terms of the loan agreement, nor any rights of set-off against the borrower, and we may not directly benefit from the collateral supporting the debt obligation in which it has purchased the participation. As a result, we will assume the credit risk of both the borrower and the institution selling the participation. The bank loans acquired by us are likely to be below investment-grade.
We are subject to risks associated with forming CLOs
To finance investments, we have in the past and may in the future securitize certain of our secured loans or other investments, including through the formation of one or more CLOs, such as the CLO Transaction, while retaining all or most of the subordinated notes issued in the securitization. This involves contributing a pool of assets to a special purpose entity, and selling debt interests in such entity on a non-recourse or limited-recourse basis to purchasers.
In connection with the CLO Transaction (and any other CLO we may form in the future), we depend (or will depend) in part on distributions from the CLO’s assets out of its earnings and cash flows to enable us to make distributions to shareholders. The ability of a CLO to make distributions will be, and in connection with the CLO Transaction is, subject to various limitations, including the terms and covenants of the debt it issues. The Subordinated Notes issued by the Issuer and retained by us are the most junior class of notes issued by the Issuer, are subordinated in priority of payment to the other Notes issued by the Issuer and are subject to certain payment restrictions set forth in the indenture governing the Notes issued by Issuer. Therefore, we only receive cash distributions on the Subordinated Notes if the Issuer has made all cash interest payments to all other Notes it has issued.
Also, a CLO may take actions to retain cash or other assets to satisfy asset coverage requirements or other tests commonly provided for holders of the CLO’s debt, which could impact our ability to receive distributions from the CLO. With respect to the CLO Transaction, if the Issuer does not meet the asset coverage tests or the interest coverage test set forth in the documents governing the CLO Transaction, cash would be diverted from the Subordinated Notes that we hold to first pay the more senior Notes issued by the Issuer in amounts sufficient to cause such tests to be satisfied. If we do not receive cash flow from any such CLO, including in connection with the CLO Transaction, that is necessary to satisfy the annual distribution requirement for maintaining RIC status, and we are unable to obtain cash from other sources necessary to satisfy this requirement, we may not maintain our qualification as a RIC, which would have a material adverse effect on an investment in the shares.
In addition, a decline in the credit quality of loans in a CLO due to poor operating results of the relevant borrower or increases in defaults, among other things, may result in a reduction of earnings and, in turn, cash potentially available for distribution to us for distribution to shareholders. To the extent that any losses are incurred by the CLO in respect of any collateral, including, with respect to the CLO Transaction, the value of the portfolio of loan investments held by the Issuer, such losses will be borne first by us as owner of equity interests in the CLO and, in the case of the CLO Transaction, the value of the Subordinated Notes that we have retained could be reduced at their redemption and could not be paid in full or at all.
We invest in structured products and such investments may involve significant risks.
We invest, to a limited extent, in structured products, which may include CDOs, CLOs (including the equity tranches thereof), structured notes, and credit-linked notes. These investment entities may be structured as trusts or other types of pooled investment vehicles. They may also involve the deposit with or purchase by an entity of the underlying investments and the issuance by that entity of one or more classes of securities backed by, or representing interests in, the underlying investments or referencing an indicator related to such investments. CDOs and CLOs are types of asset-backed securities issued by special purpose vehicles created to reapportion the risk and return characteristics of a pool of assets. The underlying pool for a CLO, for example, may include domestic and foreign senior loans, senior unsecured loans, and subordinate corporate loans. Generally, these are not qualified as eligible portfolio companies. Investments in the equity tranche or any similarly situated tranche of a structured product involve a greater degree of risk than investments in other tranches, and such investments will be the first to bear losses incurred by a structured product.
33
Our CLO investments are typically highly levered and subject to a higher degree of risk of total loss.
CLO vehicles that we invest in are typically very highly levered, and therefore, the junior debt and equity tranches that we invest in are subject to a higher degree of risk of total loss. We will generally have the right to receive payments only from the CLO vehicles, and will generally not have direct rights against the underlying borrowers or the entity that sponsored the CLO vehicle. The failure by a CLO vehicle in which we invest to satisfy certain financial covenants, specifically those with respect to adequate collateralization and/or interest coverage tests, could lead to a reduction in its payments to us. In the event that a CLO vehicle failed those tests, holders of debt senior to us may be entitled to additional payments that would, in turn, reduce the payments we would otherwise be entitled to receive. If any of these occur, it could materially and adversely affect our operating results and cash flows.
In addition to the general risks associated with investing in debt securities, CLO vehicles carry additional risks, including: (i) the possibility that distributions from collateral securities will not be adequate to make interest or other payments; (ii) the quality of the collateral may decline in value or default; (iii) the fact that our investments in CLO tranches will likely be subordinate to other senior classes of note tranches thereof; and (iv) the complex structure of the security may not be fully understood at the time of investment and may produce disputes with the CLO vehicle or unexpected investment results. Our net asset value may also decline over time if our principal recovery with respect to CLO equity investments is less than the price we paid for those investments.
Investments in structured vehicles, including equity and junior debt instruments issued by CLO vehicles, involve risks, including credit risk and market risk. Changes in interest rates and credit quality may cause significant price fluctuations. Additionally, changes in the underlying leveraged corporate loans held by a CLO vehicle may cause payments on the instruments we hold to be reduced, either temporarily or permanently. Structured investments, particularly the subordinated interests in which we intend to invest, may be less liquid than many other types of securities and may be more volatile than the leveraged corporate loans underlying the CLO vehicles we intend to target. Fluctuations in interest rates may also cause payments on the tranches of CLO vehicles that we hold to be reduced, either temporarily or permanently.
The accounting and tax implications of such investments are complicated. In particular, reported earnings from the equity tranche investments of these CLO vehicles are recorded under generally accepted accounting principles based upon an effective yield calculation. Current taxable earnings on these investments, however, will generally not be determinable until after the end of the fiscal year of each individual CLO vehicle that ends within our fiscal year, even though the investments are generating cash flow. In general, the tax treatment of these investments may result in higher distributable earnings in the early years and a capital loss at maturity, while for reporting purposes the totality of cash flows are reflected in a constant yield to maturity.
Interests we acquire in CLO vehicles will likely be thinly traded or have only a limited trading market and may be subject to restrictions on resale. Securities issued by CLO vehicles are generally not listed on any U.S. national securities exchange and no active trading market may exist for the securities of CLO vehicles in which we may invest. Although a secondary market may exist for our investments in CLO vehicles, the market for our investments in CLO vehicles may be subject to irregular trading activity, wide bid/ask spreads and extended trade settlement periods. As a result, these types of investments may be more difficult to value.
We may be subject to lender liability and equitable subordination.
In recent years, a number of judicial decisions in the United States have upheld the right of borrowers to sue lending institutions on the basis of various evolving legal theories (collectively termed “lender liability”). Generally, lender liability is founded upon the premise that an institutional lender has violated a duty (whether implied or contractual) of good faith and fair dealing owed to the borrower or has assumed a degree of control over the borrower resulting in creation of a fiduciary duty owed to the borrower or its other creditors or stockholders. Because of the nature of certain of our investments, we could be subject to allegations of lender liability.
In addition, under common law principles that in some cases form the basis for lender liability claims, if a lending institution (i) intentionally takes an action that results in the undercapitalization of a borrower to the detriment of other creditors of such borrower, (ii) engages in other inequitable conduct to the detriment of such other creditors, (iii) engages in fraud with respect to, or makes misrepresentations to, such other creditors or (iv) uses its influence as a stockholder to dominate or control a borrower to the detriment of the other creditors of such borrower, a court may elect to subordinate the claim of the offending lending institution to the claims of the disadvantaged creditor or creditors, a remedy called “equitable subordination.” Because of the nature of certain of our investments, we could be subject to claims from creditors of an obligor that our investments issued by such obligor should be equitably subordinated. A significant number of our investments will involve investments in which we will not be the lead creditor. It is, accordingly, possible that lender liability or equitable subordination claims affecting our investments could arise without our direct involvement.
If we purchase debt securities of an affiliate of a portfolio company in the secondary market at a discount, (i) a court might require us to disgorge profit it realizes if the opportunity to purchase such securities at a discount should have been made available to the issuer of such securities or (ii) we might be prevented from enforcing such securities at their full face value if the issuer of such securities becomes bankrupt.
Our failure to make follow-on investments in our portfolio companies could impair the value of our portfolio.
Following an initial investment in a portfolio company, we may decide to provide additional funds to such portfolio company, in order to:
34
There is no assurance that we will make follow-on investments or that we will have sufficient funds to make all or any of such investments. Even if we have sufficient capital to make a desired follow-on investment, we may elect not to make a follow-on investment because we may not want to increase our concentration of risk, because we prefer other opportunities or because we are restricted by compliance with BDC requirements of the 1940 Act or the desire to maintain our qualification as a RIC. Any decision by us not to make follow-on investments or our inability to make such investments may have a substantial adverse effect on a portfolio company in need of such an investment. Additionally, a failure to make such investments may result in a lost opportunity for us to increase our participation in a successful portfolio company or the dilution of our ownership in a portfolio company if a third party invests in the portfolio company.
Our portfolio may include equity investments, which are subordinated to debt investments and are subject to additional risks.
We expect to make select equity investments in the common or preferred stock of a company, all of which are subordinated to debt investments. In addition, when we invest in first lien secured debt, second lien secured debt or subordinated debt, we may acquire warrants to purchase equity investments from time to time. Our goal is ultimately to dispose of these equity investments and realize gains upon our disposition of such interests. However, the equity investments we receive may not appreciate in value and, in fact, may decline in value. Accordingly, we may not be able to realize gains from our equity investments, and any gains that we do realize on the disposition of any equity investments may not be sufficient to offset any other losses we experience. In addition, many of the equity securities in which we invest may not pay dividends on a regular basis, if at all.
The lack of liquidity in our investments may adversely affect our businesses.
We may acquire a significant percentage of our portfolio company investments from privately held companies in directly negotiated transactions. The lack of an established, liquid secondary market for some of our investments may have an adverse effect on the market value of our investments and on our ability to dispose of them. Additionally, our investments may be subject to certain transfer restrictions that may also contribute to illiquidity. Further, our assets that are typically traded in a liquid market may become illiquid due to events relating to the issuer, market events, economic conditions or investor perceptions. Therefore, no assurance can be given that, if we are determined to dispose of a particular investment held by us, it could dispose of such investment at the prevailing market price.
Because we generally do not hold controlling equity interests in our portfolio companies, we generally will not be able to exercise control over our portfolio companies or to prevent decisions by management of our portfolio companies that could decrease the value of our investments.
We do not generally intend to hold controlling equity positions in our portfolio companies. As a result, we will be subject to the risk that a portfolio company may make business decisions with which we disagree, and that the management and/or stockholders of a portfolio company may take risks or otherwise act in ways that are adverse to our interests. Due to the potential lack of liquidity of the debt and equity investments that we hold in our portfolio companies, we may not be able to dispose of our investments in the event we disagree with the actions of a portfolio company and may therefore suffer a decrease in the value of our investments.
In addition, we may not be in a position to control any portfolio company by investing in its debt securities. As a result, we are subject to the risk that a portfolio company may make business decisions with which we disagree and the management of such company, as representatives of the holders of their common equity, may take risks or otherwise act in ways that do not serve our interests as debt investors.
Our portfolio companies could incur debt that ranks equally with, or senior to, our investments in such companies and such portfolio companies could fail to generate sufficient cash flow to service their debt obligations to us.
The characterization of certain of our investments as senior debt or senior secured debt does not mean that such debt will necessarily be repaid in priority to all other obligations of the businesses in which we invest. Furthermore, debt and other liabilities incurred by non-guarantor subsidiaries of the borrowers of senior secured loans made by us may be structurally senior to the debt held by us. In the event of insolvency, liquidation, dissolution, reorganization or bankruptcy of a portfolio company, the debt and other liabilities of such subsidiaries could be repaid in full before any distribution can be made to an obligor of the senior secured loans held by us. Finally, portfolio companies will typically incur trade credit and other liabilities or indebtedness, which by their terms may provide that their holders are entitled to receive principal payments on or before the dates payments are due in respect of the senior secured loans held by us.
Where we hold a first lien to secure senior indebtedness, the portfolio companies may be permitted to issue other senior loans with liens that rank junior to the first liens granted to us. The intercreditor rights of the holders of such other junior lien debt may, in any liquidation, reorganization, insolvency, dissolution or bankruptcy of such a portfolio company, affect the recovery that we would have been able to achieve in the absence of such other debt.
Additionally, certain loans that we may make to portfolio companies may be secured on a second priority basis by the same collateral securing senior secured debt of such companies. The first priority liens on the collateral will secure the portfolio company’s obligations under any outstanding senior debt and may secure certain other future debt that may be permitted to be incurred by the portfolio company under the agreements governing the loans. The holders of obligations secured by first priority liens on the collateral will generally control the liquidation of, and be entitled to receive proceeds from, any realization of the collateral to repay their obligations in full before us. In addition, the value of the collateral in the event of liquidation will depend on market and economic conditions, the availability of buyers and other factors. There can be no assurance that the proceeds, if any, from sales of all of the collateral would be sufficient to satisfy the loan obligations secured by the second priority liens after payment in full of all obligations secured by the first priority liens on the collateral. If such proceeds were not sufficient to repay amounts outstanding under the loan obligations secured by the second priority liens, then we, to the extent not repaid from the proceeds of the sale of the collateral, will only have an unsecured claim against the portfolio company’s remaining assets, if any.
35
Even where the senior loans held by us are secured by a perfected lien over a substantial portion of the assets of a portfolio company and its subsidiaries, the portfolio company and its subsidiaries will often be able to incur a substantial amount of additional indebtedness, which may have an exclusive lien over particular assets. For example, debt and other liabilities incurred by non-guarantor subsidiaries of portfolio companies will be structurally senior to the debt held by us. Accordingly, any such debt and other liabilities of such subsidiaries would, in the event of liquidation, dissolution, insolvency, reorganization or bankruptcy of such subsidiary, be repaid in full before any distributions to an obligor of the loans held by us. Furthermore, these other assets over which other lenders have a lien may be substantially more liquid or valuable than the assets over which we have a lien.
The rights we may have with respect to the collateral securing the loans we make to our portfolio companies with senior debt outstanding may also be limited pursuant to the terms of one or more intercreditor agreements that we enter into with the holders of such senior debt. Under a typical intercreditor agreement, at any time that obligations that have the benefit of the first priority liens are outstanding, any of the following actions that may be taken in respect of the collateral will be at the direction of the holders of the obligations secured by the first priority liens:
We may not have the ability to control or direct such actions, even if our rights are adversely affected.
We may also make unsecured debt investments in portfolio companies, meaning that such investments will not benefit from any interest in collateral of such companies. Liens on any such portfolio company’s collateral, if any, will secure the portfolio company’s obligations under its outstanding secured debt and may secure certain future debt that is permitted to be incurred by the portfolio company under its secured debt agreements. The holders of obligations secured by such liens will generally control the liquidation of, and be entitled to receive proceeds from, any realization of such collateral to repay their obligations in full before us. In addition, the value of such collateral in the event of liquidation will depend on market and economic conditions, the availability of buyers and other factors. There can be no assurance that the proceeds, if any, from sales of such collateral would be sufficient to satisfy our unsecured debt obligations after payment in full of all secured debt obligations. If such proceeds were not sufficient to repay the outstanding secured debt obligations, then our unsecured claims would rank equally with the unpaid portion of such secured creditors’ claims against the portfolio company’s remaining assets, if any.
We are subject to risks related to investments in non-U.S. securities.
Our portfolio includes debt securities of non-U.S. companies, including emerging market issuers, to the limited extent such transactions and investments would not cause us to violate the 1940 Act. Investing in loans and securities of non-U.S. issuers involves many risks including economic, social, political, financial, tax and security conditions in the non-U.S. market, potential inflationary economic environments, less liquid markets and regulation by foreign governments. There may be less information publicly available about a non-U.S. issuer than about a U.S. issuer, and non-U.S. issuers may not be subject to accounting, auditing and financial reporting standards and practices comparable to those in the United States. In addition, with respect to certain countries, there is a possibility of expropriation, imposition of non-U.S. withholding or other taxes on distributions, interest, capital gains or other income, limitations on the removal of funds or other of our assets, political or social instability or diplomatic developments that could affect investments in those countries. An issuer of securities may be domiciled in a country other than the country in whose currency the instrument is denominated. The values and relative yields of investments in the securities markets of different countries, and their associated risks, are expected to change independently of each other.
Bankruptcy law and process in non-U.S. jurisdictions may differ substantially from that in the United States, which may result in greater uncertainty as to the rights of creditors, the enforceability of such rights, reorganization timing and the classification, seniority and treatment of claims. In certain developing countries, although bankruptcy laws have been enacted, the process for reorganization remains highly uncertain, while other developing countries may have no bankruptcy laws enacted, adding further uncertainty to the process for reorganization.
We may be subject to risks if we engage in hedging transactions.
We are authorized to use various investment strategies to hedge interest rate or currency exchange risks. These strategies are generally accepted as portfolio management techniques and are regularly used by many investment funds and other institutional investors. Techniques and instruments may change over time as new instruments and strategies are developed or regulatory changes occur. We may use any or all such types of interest rate hedging transactions and currency hedging transactions at any time and no particular strategy will dictate the use of one transaction rather than another. The choice of any particular interest rate hedging transactions and currency hedging transactions will be a function of numerous variables, including market conditions. Investments or liabilities of ours may be denominated in currencies other than the U.S. dollar, and hence the value of such investments, or the amount of such liabilities, will depend in part on the relative strength of the U.S. dollar. We may be affected favorably or unfavorably by exchange control regulations or changes in the exchange rate between foreign currencies and the U.S. dollar. Changes in foreign currency exchange rates may also affect the value of dividends and interest earned as well as the level of gains and losses realized on the sale of securities. The rates of exchange between the U.S. dollar and other currencies are affected by many factors, including forces of supply and demand in the foreign exchange markets. These rates are also affected by the international balance of payments and other economic and financial conditions, government intervention, speculation and other factors. We are not obligated to engage in any currency hedging operations, and there can be no assurance as to the success of any hedging operations that we may implement.
36
Although we intend to engage in any interest rate hedging transactions and currency hedging transactions primarily for hedging purposes and not for income or enhancing total returns, use of interest rate hedging transactions and currency hedging transactions involves certain inherent risks. These risks include (i) the possibility that the market will move in a manner or direction that would have resulted in gain for us had an interest rate hedging transaction or currency hedging transaction not been utilized, in which case it would have been better had we not engaged in the interest rate hedging transaction or currency hedging transaction, (ii) the risk of imperfect correlation between the risk sought to be hedged and the interest rate hedging transaction or currency hedging transaction utilized, (iii) potential illiquidity for the hedging instrument utilized, which may make it difficult for us to close-out or unwind an interest rate hedging transaction or currency hedging transaction and (iv) credit risk with respect to the counterparty to the interest rate hedging transaction or currency hedging transaction. In addition, it might not be possible for us to hedge fully or perfectly against currency fluctuations affecting the value of securities denominated in non-U.S. currencies because the value of those loans and securities would likely fluctuate as a result of factors not related to currency fluctuations.
We may also enter into certain hedging and short sale transactions for the purpose of protecting the market value of an investment of ours for a period of time without having to currently dispose of such investment. Such defensive hedge transactions may be entered into when we are legally restricted from selling an investment or when we otherwise determine that it is advisable to decrease our exposure to the risk of a decline in the market value of an investment. Such defensive hedging transactions may expose us to the counterparty’s credit risk. There also can be no assurance that we will accurately assess the risk of a market value decline with respect to an investment or enter into an appropriate defensive hedge transaction to protect against such risk. Furthermore, we are in no event obligated to enter into any defensive hedge transaction. We may from time to time employ various investment programs, including the use of derivatives, short sales, swap transactions, currency hedging transactions, securities lending agreements and repurchase agreements. There can be no assurance that any such investment program will be undertaken successfully.
We may invest in derivatives or other assets that expose us to certain risks, including market risk, liquidity risk and other risks similar to those associated with the use of leverage.
We may invest in derivatives and other assets that are subject to many of the same types of risks related to the use of leverage. In October 2020, the SEC adopted Rule 18f-4 under the 1940 Act regarding the ability of a BDC to use derivatives and other transactions that create future payment or delivery obligations. Under Rule 18f-4, BDCs that use derivatives are subject to a value-at-risk leverage limit, a derivatives risk management program and testing requirements and requirements related to board reporting. These requirements apply unless the BDC qualifies as a “limited derivatives user,” as defined under Rule 18f-4. Under Rule 18f-4, a BDC may enter into an unfunded commitment agreement (which may include delayed draw and revolving loans) that will not be deemed to be a derivatives transaction, such as an agreement to provide financing to a portfolio company, if the BDC has, among other things, a reasonable belief, at the time it enters into such an agreement, that it will have sufficient cash and cash equivalents to meet its obligations with respect to all of its unfunded commitment agreements, in each case as it becomes due. Collectively, these requirements may limit our ability to use derivatives and/or enter into certain other financial contracts.
We have adopted updated policies and procedures in compliance with Rule 18f-4. We expect to qualify as a “limited derivatives user.” Future legislation or rules may modify how we treat derivatives and other financial arrangements for purposes of our compliance with the leverage limitations of the 1940 Act and, therefore, may increase or decrease the amount of leverage currently available to us under the 1940 Act, which may be materially adverse to us and our stockholders.
Our investments in OID and PIK interest income may expose us to risks associated with such income being required to be included in accounting income and taxable income prior to receipt of cash.
Our investments may include OID and PIK instruments. To the extent OID and PIK interest income constitute a portion of our income, we will be exposed to risks associated with such income being required to be included in an accounting income and taxable income prior to receipt of cash, including the following:
37
Federal Income Tax and Other Tax Risks
We will be subject to corporate-level income tax if we are unable to qualify as a RIC.
In order to qualify and be subject to tax as a RIC under the Code, we must be a BDC at all times during each taxable year and meet certain source-of-income, asset diversification and distribution requirements. If we do not maintain our status as a BDC, we may fail to qualify as a RIC and, thus, may be subject to corporate-level income tax. The distribution requirement for a RIC is satisfied if we distribute dividends in respect of each taxable year of an amount generally at least equal to 90% of our investment company taxable income, determined without regard to any deduction for dividends paid, to our stockholders. We are subject to certain asset coverage ratio requirements under the 1940 Act and financial covenants under loan and credit agreements that could, under certain circumstances, restrict us from making distributions necessary to enable us to be subject to tax as a RIC. If we are unable to obtain cash from other sources, we may fail to be subject to tax as a RIC and, thus, may be subject to corporate-level income tax. To qualify to be subject to tax as a RIC, we must also meet certain asset diversification requirements at the end of each quarter of our taxable year. Failure to meet these tests may result in our having to dispose of certain investments quickly in order to satisfy these requirements. Because most of our investments will be in private or thinly traded public companies, any such dispositions could be made at disadvantageous prices and may result in substantial losses. If we fail to qualify to be subject to tax as a RIC for any reason and become subject to corporate income tax, the resulting corporate taxes could substantially reduce our net assets, the amount of income available for distributions to our stockholders and the amount of funds available for new investments. Such a failure would have a material adverse effect on us and our stockholders.
We may have difficulty paying our required distributions if we recognize income before, or without, receiving cash representing such income.
For U.S. federal income tax purposes, we will include in income certain amounts that we have not yet received in cash, such as the accretion of OID. This may arise if we receive warrants in connection with the making of a loan and in other circumstances, or through contracted PIK interest, which represents contractual interest added to the loan balance and due at the end of the loan term. Such OID, which could be significant relative to our overall investment activities, or increases in loan balances as a result of contracted PIK arrangements, will be included in income before we receive any corresponding cash payments. We also may be required to include in income certain other amounts that we will not receive in cash.
Since in certain cases we may recognize income before or without receiving cash representing such income, we may have difficulty meeting the requirement in a given taxable year to distribute at least 90% of our investment company taxable income, determined without regard to any deduction for dividends paid, as dividends to our stockholders in order to be subject to tax as a RIC. In such a case, we may have to sell some of our investments at times we would not consider advantageous, raise additional debt or equity capital or reduce new investment originations to meet these distribution requirements. If we are not able to obtain such cash from other sources, we may fail to be subject to tax as a RIC and thus be subject to corporate-level income tax.
We may be required to withhold U.S. federal income tax on distributions to non-U.S. stockholders.
Distributions by a BDC generally are treated as dividends for U.S. tax purposes, and will be subject to U.S. income or withholding tax unless the stockholder receiving the dividend qualifies for an exemption from U.S. tax, or the distribution is subject to one of the special look-through rules described below. Distributions paid out of net capital gains can qualify for a reduced rate of taxation in the hands of an individual U.S. stockholder, and an exemption from U.S. tax in the hands of a non-U.S. stockholder.
However, if reported by a RIC, dividend distributions by the RIC derived from certain interest income (such distributions, “interest-related dividends”) and certain net short-term capital gains (such distributions, “short-term capital gain dividends”) generally are exempt from U.S. withholding tax otherwise imposed on non-U.S. stockholders. Interest-related dividends are dividends that are attributable to “qualified net interest income” (i.e., “qualified interest income,” which generally consists of certain interest and OID on obligations “in registered form” as well as interest on bank deposits earned by a RIC, less allocable deductions) from sources within the United States. Short-term capital gain dividends are dividends that are attributable to net short-term capital gains, other than short-term capital gains recognized on the disposition of U.S. real property interests, earned by a RIC. However, no assurance can be given as to whether any of our distributions will be eligible for this exemption from U.S. withholding tax or, if eligible, will be reported as such by us. Furthermore, in the case of shares of our stock held through an intermediary, the intermediary may have withheld U.S. federal income tax even if we reported the payment as an interest-related dividend or short-term capital gain dividend. Since our common stock will be subject to significant transfer restrictions, and an investment in our common stock will generally be illiquid, non-U.S. stockholders whose distributions on our common stock are subject to U.S. withholding tax may not be able to transfer their shares of our common stock easily or quickly or at all.
A failure of any portion of our distributions to qualify for the exemption for interest-related dividends or short-term capital gain dividends would not affect the treatment of non-U.S. stockholders that qualify for an exemption from U.S. withholding tax on dividends by reason of their special status (for example, foreign government-related entities and certain pension funds resident in favorable treaty jurisdictions).
38
Our business may be adversely affected if we fail to maintain our qualification as a RIC.
To maintain RIC tax treatment under the Code, we must be a BDC at all times during each taxable year and meet the following minimum annual distribution, income source and asset diversification requirements. The minimum annual distribution requirement for a RIC will be satisfied if we distribute dividends to our stockholders in respect of each taxable year of an amount generally at least equal to 90% of our investment company taxable income, determined without regard to any deduction for dividends paid. In this regard, a RIC may, in certain cases, satisfy the 90% distribution requirement by distributing dividends relating to a taxable year after the close of such taxable year under the “spillback dividend” provisions of Subchapter M of the Code. We would be taxed, at regular corporate rates, on any retained income and/or gains, including any short-term capital gains or long-term capital gains. We must also satisfy an additional annual distribution requirement with respect to each calendar year in order to avoid a 4% excise tax on the amount of any under-distribution. Because we may use debt financing, we are subject to (i) an asset coverage ratio requirement under the 1940 Act and may, in the future, be subject to (ii) certain financial covenants under loan and credit agreements that could, under certain circumstances, restrict us from making distributions necessary to satisfy the distribution requirements. If we are unable to obtain cash from other sources, or chose or be required to retain a portion of our taxable income or gains, we could (1) be required to pay excise tax and (2) fail to qualify for RIC tax treatment, and thus become subject to corporate-level income tax on our taxable income (including gains).
The income source requirement will be satisfied if we obtain at least 90% of our gross income each taxable year from dividends, interest, gains from the sale of stock or securities, or other income derived from the business of investing in stock or securities. The asset diversification requirement will be satisfied if we meet certain asset diversification requirements at the end of each quarter of our taxable year. To satisfy this requirement, at least 50% of the value of our assets at the close of each quarter of each taxable year must consist of cash, cash equivalents (including receivables), U.S. Government securities, securities of other RICs, and other acceptable securities; and no more than 25% of the value of our assets can be invested in the securities, other than U.S. government securities or securities of other RICs, of one issuer, of two or more issuers that are controlled, as determined under applicable Code rules, by us and that are engaged in the same or similar or related trades or businesses or of certain “qualified publicly traded partnerships.” Failure to meet these requirements may result in our having to dispose of certain investments quickly in order to prevent the loss of RIC status. Because a significant portion of our investments will be in private companies, and therefore may be relatively illiquid, any such dispositions could be made at disadvantageous prices and could result in substantial losses.
We may invest in certain debt and equity investments through taxable subsidiaries and the net taxable income of these taxable subsidiaries will be subject to federal and state corporate income taxes. We also may invest in certain foreign debt and equity investments which could be subject to foreign taxes (such as income tax, withholding, and value added taxes). If we fail to qualify for or maintain RIC tax treatment for any reason and are subject to corporate income tax, the resulting corporate taxes could substantially reduce our net assets, the amount of income available for distribution, and the amount of our distributions.
There is a risk that you may not receive distributions or that our distributions may not grow over time and a portion of our distributions may be a return of capital.
We intend to make distributions on a quarterly basis to our stockholders out of assets legally available for distribution. We cannot assure you that we will achieve investment results that will allow us to make a specified level of cash distributions or year-to-year increases in cash distributions. Our ability to pay distributions might be adversely affected by the impact of one or more of the risk factors described in this Annual Report. Due to the asset coverage test applicable to us under the 1940 Act as a BDC and certain limitations under Maryland law, we may be limited in our ability to make distributions. In addition, if we violate certain covenants under our credit facilities, or any future credit or other borrowing facility, our ability to pay distributions to our stockholders could be limited because we may be required by its terms to use all payments of interest and principal that we receive from our current investments as well as any proceeds received from the sale of our current investments to repay amounts outstanding thereunder.
Furthermore, the tax treatment and characterization of our distributions may vary significantly from time to time due to the nature of our investments. The ultimate tax characterization of our distributions made during a taxable year may not finally be determined until after the end of that taxable year. We may make distributions during a taxable year that exceed our investment company taxable income and net capital gains for that taxable year. In such a situation, the amount by which our total distributions exceed investment company taxable income and net capital gains generally would be treated as a return of capital up to the amount of a stockholder’s tax basis in the shares, with any amounts exceeding such tax basis treated as a gain from the sale or exchange of such shares. A return of capital generally is a return of a stockholder’s investment rather than a return of earnings or gains derived from our investment activities. Moreover, we may pay all or a substantial portion of our distributions from the proceeds of the sale of shares of our common stock or from borrowings in anticipation of future cash flow, which could constitute a return of stockholders’ capital and will lower such stockholders’ tax basis in our shares, which may result in increased tax liability to stockholders when they sell such shares.
General Risk Factors
Global capital markets may experience periods of severe disruption and instability in the future. These conditions have historically affected and could again materially and adversely affect debt and equity capital markets in the United States and around the world and our business.
The U.S. and global capital markets have, from time to time, experienced periods of disruption characterized by the freezing of available credit, a lack of liquidity in the debt capital markets, significant losses in the principal value of investments, the re-pricing of credit risk in the broadly syndicated credit market, the failure of major financial institutions and general volatility in the financial markets. During these periods of disruption, general economic conditions deteriorated with material and adverse consequences for the broader financial and credit markets, and the availability of debt and equity capital for the market as a whole, and financial services firms in particular, was reduced significantly. These conditions may reoccur for a prolonged period of time or materially worsen in the future.
We may in the future have difficulty accessing debt and equity capital markets, and a severe disruption in the global financial markets, deterioration in credit and financing conditions, uncertainty between the United States and other countries with respect to trade policies, or uncertainty regarding U.S. government spending and deficit levels or other global economic and political conditions, including future recessions, political instability, geopolitical turmoil and foreign hostilities, and disease, pandemics and other serious health events, could have a material adverse effect on our business, financial condition and results of operations.
39
Inflation may adversely affect the business, results of operations and financial condition of our portfolio companies.
Certain of our portfolio companies are in industries that may be impacted by inflation. If such portfolio companies are unable to pass any increases in their costs of operations along to their customers, it could adversely affect their operating results and impact their ability to pay interest and principal on our loans, particularly if interest rates rise in response to inflation. In addition, any projected future decreases in our portfolio companies’ operating results due to inflation could adversely impact the fair value of those investments. Any decreases in the fair value of our investments could result in future realized or unrealized losses and therefore reduce our net increase (decrease) in net assets resulting from operations.
Events outside of our control, including public health crises, could negatively affect our portfolio companies, our Investment Advisor and the results of our operations.
Periods of market volatility could continue to occur in response to pandemics or other events outside of our control. We, the Investment Advisor, and the portfolio companies in which we invest in could be affected by force majeure events (i.e., events beyond the control of the party claiming that the event has occurred, such as acts of God, fire, flood, earthquakes, outbreaks of an infectious disease, pandemic or any other serious public health concern, acts of war, terrorism, labor strikes, major plant breakdowns, pipeline or electricity line ruptures, failure of technology, defective design and construction, accidents, demographic changes, government macroeconomic policies, social instability, etc.). Some force majeure events could adversely affect the ability of a party (including us, the Investment Advisor, a portfolio company or a counterparty to us, the Investment Advisor, or a portfolio company) to perform its obligations until it is able to remedy the force majeure event or could lead to the unavailability of essential equipment and technologies. These risks could, among other effects, adversely impact the cash flows available from a portfolio company, damage property, cause personal injury or loss of life, or instigate disruptions of service. Certain events causing catastrophic loss could be either uninsurable, or insurable at such high rates as to adversely impact us, the Investment Advisor, or our portfolio companies, as applicable, and insurance proceeds received, if any, could be inadequate to completely or even partially cover any loss of revenues or investments, any increases in operating and maintenance expenses, or any replacements or rehabilitation of property. Force majeure events that are incapable of or are too costly to cure could have permanent adverse effects.
In addition, certain force majeure events (such as events of war or an outbreak of an infectious disease, such as the global outbreak of COVID-19) could have a broader negative impact on the world economy and international business activity generally, or in any of the countries in which we invest or in which our portfolio companies operate. Such force majeure events could result in or coincide with: increased volatility in the global securities, derivatives and currency markets; a decrease in the reliability of market prices and difficulty in valuing assets; greater fluctuations in currency exchange rates; increased risk of default (by both government and private issuers); further social, economic, and political instability; nationalization of private enterprise; greater governmental involvement in the economy or in social factors that impact the economy; less governmental regulation and supervision of the securities markets and market participants and decreased monitoring of the markets by governments or self-regulatory organizations and reduced enforcement of regulations; limited, or limitations on, the activities of investors in such markets; controls or restrictions on foreign investment, capital controls and limitations on repatriation of invested capital; inability to purchase and sell investments or otherwise settle security or derivative transactions (i.e., a market freeze); unavailability of currency hedging techniques; substantial, and in some periods extremely high, rates of inflation, which can last many years and have substantial negative effects on credit and securities markets as well as the economy as a whole; recessions; and difficulties in obtaining and/or enforcing legal judgments.
Additionally, a major governmental intervention into industry, including the nationalization of an industry or the assertion of control over one or more portfolio companies or its assets, could result in a loss to us, including if the investment in such portfolio companies is canceled, unwound or acquired (which could result in inadequate compensation). Any of the foregoing could therefore have an adverse effect on our business and results of operations.
Global economic, political and market conditions, including downgrades of the U.S. credit rating, may adversely affect our business, results of operations and financial condition.
The current global financial market situation, as well as various social and political tensions in the United States and around the world (including the bilateral relationship between the U.S. and China, the conflict in the Red Sea and the conflict between Russia and Ukraine), may contribute to increased market volatility, may have long-term effects on the United States and worldwide financial markets and may cause economic uncertainties or deterioration in the U.S. and worldwide. The impact of downgrades by rating agencies to the U.S. government’s sovereign credit rating or its perceived creditworthiness as well as potential government shutdowns and uncertainty surrounding transfers of power could adversely affect the U.S. and global financial markets and economic conditions.
The Russian invasion of Ukraine and the conflicts in the Middle East may have a material adverse impact on us and our portfolio companies.
The conflict between Russia and Ukraine and in the Middle East could lead to disruption, instability and volatility in global markets, economies and industries that could negatively impact our business, results of operations and financial condition. The conflicts have already resulted in significant volatility in certain equity, debt and currency markets, material increases in certain commodity prices, and economic uncertainty. The conflict may escalate and its resolution is unclear. For example, the U.S. government and other governments have imposed severe sanctions against Russia and Russian interests and threatened additional sanctions and controls. Sanctions and export control laws and regulations are complex, frequently changing, and increasing in number, and they may impose additional legal compliance costs or business risks associated with our operations. Because this is an uncertain and evolving situation, its full impact is unknown at this time.
In addition, the ongoing conflict involving the Middle East may also cause additional inflation, disrupt supply chains and potentially destabilize the region. These ongoing conflicts may also disrupt local, regional, national, and global markets and economies affected by sanctions, and it is not possible to predict how long any such disruption may last. It is also not possible to predict with certainty these ongoing conflicts’ additional adverse effects on existing macroeconomic conditions, currency exchange rates, and financial markets, all of which may affect our business operations or the business operations of our portfolio companies.
40
New or modified laws or regulations governing our operations could adversely affect our business.
We and our portfolio companies will be subject to regulation by laws at the U.S. federal, state and local levels. These laws and regulations, as well as their interpretation, may change from time to time, and new laws, regulations and interpretations may also come into effect. Any such new or changed laws or regulations could have a material adverse effect on our business.
Uncertainty about presidential administration initiatives could negatively impact our business, financial condition and results of operations.
There is significant uncertainty with respect to legislation, regulation and government policy at the federal level, as well as at the state and local levels. Recent events, including the 2024 U.S. presidential election, have created a climate of heightened uncertainty and introduced new and difficult-to-quantify macroeconomic and political risks with potentially far-reaching implications. The presidential administration’s changes to U.S. policy may impact, among other things, the U.S. and global economy, international trade and relations, unemployment, immigration, taxes, healthcare, the U.S. regulatory environment, inflation and other areas. Although we cannot predict the impact, if any, of these changes to our business, they could adversely affect our business, financial condition, operating results and cash flows. Until we know what policy changes are made and how those changes impact our business and the business of our competitors over the long term, we will not know if, overall, we will benefit from them or be negatively affected by them.
Our business is dependent on bank relationships and strain on the banking system may adversely impact us.
The financial markets have in the past encountered volatility associated with concerns about the balance sheets of banks, especially small and regional banks who may have significant losses associated with investments that make it difficult to fund demands to withdraw deposits and other liquidity needs. Although the federal government has announced measures to assist these banks and protect depositors, others may be materially and adversely impacted. Our business is dependent on bank relationships, including small and regional banks, and we proactively monitor the financial health of banks with which we (or our portfolio companies) do or may in the future do business. To the extent that our portfolio companies work with banks that are negatively impacted by the foregoing, such portfolio companies’ ability to access their own cash, cash equivalents and investments may be threatened. In addition, such affected portfolio companies may not be able to enter into new banking arrangements or credit facilities, or receive the benefits of their existing banking arrangements or credit facilities. Any such developments could harm our business, financial condition, and operating results, and prevent us from fully implementing our investment plan. Continued strain on the banking system may adversely impact our business, financial condition and results of operations.
A significant adverse development with one or more national or regional banks, financial institutions or other participants in the financial or capital markets may spread to others and lead to significant concentrated or market-wide problems (such as defaults, liquidity problems, impairment charges, additional bank runs and/or losses) for other participants in these markets. Future developments, including actions taken by the U.S. Department of Treasury, Federal Deposit Insurance Corporation and Federal Reserve Board, and systemic risk in the U.S. and global banking sectors and broader economies in general, are difficult to assess and quantify, and the form and magnitude of such developments or other actions could have an adverse effect on our business, financial condition and results of operations.
Risks Relating to Our Common Stock
Investing in our common stock involves an above average degree of risk.
The investments we make in accordance with our investment objectives may result in a higher amount of risk than alternative investment options and a higher risk of volatility or loss of principal. Therefore, an investment in shares of our common stock may not be suitable for someone with lower risk tolerance. In addition, our common stock is intended for long-term investors who can accept the risks of investing primarily in illiquid loans and other debt or debt-like instruments and should not be treated as a trading vehicle.
The market price of our common stock may fluctuate significantly.
We currently list our common stock on the NYSE under the symbol “PSBD.” The market price and liquidity of the market for shares of our common stock may be significantly affected by numerous factors, some of which are beyond our control and may not be directly related to our operating performance. These factors include:
41
In the past, following periods of volatility in the market price of a company’s securities, securities class action litigation has often been brought against that company. If our stock price fluctuates significantly, we may be the target of securities litigation in the future. Securities litigation could result in substantial costs and divert management’s attention and resources from our business.
We cannot assure you that a market for shares of our common stock will be maintained or the market price of our shares will trade close to NAV.
We cannot assure you that a trading market for our common stock can be sustained. In addition, we cannot predict the prices at which our common stock will trade, whether at, above or below NAV. Shares of closed-end investment companies, including BDCs, frequently trade at a discount from NAV, and our common stock may also be discounted in the market. This characteristic of closed-end investment companies is separate and distinct from the risk that our NAV per share may decline. In addition, if our common stock trades below its NAV, we will generally not be able to sell additional shares of our common stock to the public at its market price without, among other things, the requisite stockholders’ approval of such a sale.
Sales of substantial amounts of our common stock in the public market may have an adverse effect on the market price of our common stock.
Sales of substantial amounts of our common stock, or the availability of such shares for sale, could adversely affect the prevailing market prices for our common stock. If this occurs and continues, it could impair our ability to raise additional capital through the sale of equity securities should we desire to do so.
Purchases of shares of our common stock by us under our open market repurchase program, including the Company Rule 10b5-1 Stock Repurchase Plan, and by PSCM, including through the PSCM Rule 10b5-1 Stock Purchase Plan, may result in the price of shares of our common stock being higher than the price that otherwise might exist in the open market.
Our Board authorized us to repurchase shares of our common stock through an open-market share repurchase program for up to $20 million in the aggregate of shares of our common stock through 12 months from the date of the IPO. Pursuant to such authorization and concurrently with the closing of the IPO, we entered into the Company Rule 10b5-1 Stock Repurchase Plan to acquire up to $15 million in the aggregate of shares of our common stock, in accordance with the guidelines specified in Rule 10b-18 and Rule 10b5-1 of the Exchange Act. In addition, PSCM will purchase up to $5 million in the aggregate of shares of our common stock in the open market within one year of the date of the IPO. Concurrently with the closing of the IPO, PSCM entered into the PSCM Rule 10b5-1 Stock Purchase Plan to permit the purchase of up to $2.5 million of our shares of common stock in connection with its purchase commitment. These activities may have the effect of maintaining the market price of shares of our common stock or retarding a decline in the market price of the shares of our common stock, and, as a result, the price of our shares of common stock may be higher than the price that otherwise might exist in the open market.
We may in the future determine to issue preferred stock, which could adversely affect the market value of our common stock.
The issuance of shares of preferred stock with dividend or conversion rights, liquidation preferences or other economic terms more favorable to the holders of preferred stock than to our common stockholders could adversely affect the market price for our common stock by making an investment in the common stock less attractive. In addition, the dividends on any preferred stock we issue must be cumulative. Payment of dividends and repayment of the liquidation preference of preferred stock must take preference over any distributions or other payments to our common stockholders, and holders of preferred stock are not subject to any of our expenses or losses and are not entitled to participate in any income or appreciation in excess of their stated preference (other than convertible preferred stock that converts into common stock). In addition, under the 1940 Act, participating preferred stock and preferred stock constitutes a “senior security” for purposes of the asset coverage test.
42
Provisions of the Maryland General Corporation Law and of our charter and bylaws could deter takeover attempts and have an adverse impact on the price of our common stock.
The Maryland General Corporation Law, our charter and our bylaws contain provisions that may discourage, delay or make more difficult a change in control or the removal of our directors. We are subject to Subtitle 6 of Title 3 of the Maryland General Corporate Law, the Maryland Business Combination Act, subject to any applicable requirements of the 1940 Act. Our Board has adopted a resolution exempting from the Business Combination Act any business combination between us and any other person, subject to prior approval of such business combination by our Board, including approval by a majority of our independent directors. If the resolution exempting business combinations is repealed or our Board does not approve a business combination, the Business Combination Act may discourage third parties from trying to acquire control of us and increase the difficulty of consummating such an offer. We are subject to Subtitle 7 of Title 3 of the Maryland General Corporate Law, the Maryland Control Share Acquisition Act. Our bylaws exempt from the Maryland Control Share Acquisition Act acquisitions of our common stock by any person. If we amend our bylaws to repeal the exemption from the Control Share Acquisition Act, the Control Share Acquisition Act also may make it more difficult for a third party to obtain control of us and increase the difficulty of consummating such an offer. We intend to give the SEC prior notice should our Board elect to amend our bylaws to repeal the exemption from the Control Share Acquisition Act.
We have also adopted other measures that may make it difficult for a third party to obtain control of us, including provisions of our charter classifying our Board in three classes serving staggered three-year terms, and provisions of our charter authorizing our Board to classify or reclassify shares of our stock in one or more classes or series, to cause the issuance of additional shares of our stock, and to amend our charter, without stockholder approval, to increase or decrease the number of shares of stock that we have authority to issue. These provisions, as well as other provisions of our charter and bylaws, may delay, defer or prevent a transaction or a change in control that might otherwise be in the best interests of our stockholders.
ITEM 1B. UNRESOLVED STAFF COMMENTS
None.
ITEM 1C. CYBERSECURITY
We have processes in place to assess, identify, and manage material risks from cybersecurity threats. Our business is dependent on the communications and information systems of the Investment Advisor and other third-party service providers. The Investment Advisor manages our day-to-day operations and has implemented a cybersecurity program that applies to us and our business.
Cybersecurity Program Overview
The Investment Advisor has instituted a cybersecurity program designed to identify, assess, and mitigate cyber risks applicable to us and to protect the systems, data and other digital assets of the Company. The cyber risk management program involves risk assessments, implementation of security measures, and ongoing monitoring of systems and networks, including networks on which we rely. The Investment Advisor actively monitors the current threat landscape in an effort to identify material risks arising from new and evolving cybersecurity threats, including material risks faced by us.
We rely on the Investment Advisor to
We depend on and engage various third parties, including suppliers, vendors, and service providers, to operate our business. We rely on the expertise of risk management, legal, information technology, and compliance personnel of the Investment Advisor when identifying and overseeing risks from cybersecurity threats associated with our use of such entities.
Board Oversight of Cybersecurity Risks
The Board provides strategic oversight on cybersecurity matters, including risks associated with cybersecurity threats.
Management’s Role in Cybersecurity Risk Management
43
Assessment of Cybersecurity Risk
The potential impact of risks from cybersecurity threats on us are assessed on an ongoing basis, and how such risks could materially affect our business strategy, operational results, and financial condition are regularly evaluated. During the reporting period,
ITEM 2. PROPERTIES
Our headquarters are located at 1900 Shawnee Mission Parkway, Suite 315, Mission Woods, Kansas 66205. We believe that our office facilities are suitable and adequate for our business.
ITEM 3. LEGAL PROCEEDINGS
We are not currently subject to any material legal proceedings, nor, to our knowledge, is any material legal proceeding threatened against us. From time to time, we may be a party to certain legal proceedings in the ordinary course of business, including proceedings relating to the enforcement of our rights under loans to or other contracts with our portfolio companies.
ITEM 4. MINE SAFETY DISCLOSURES
None.
44
PART II
ITEM 5. MARKET FOR REGISTRANT’S COMMON EQUITY, RELATED STOCKHOLDER MATTERS AND ISSUER PURCHASES OF EQUITY SECURITIES
Market Information
Our common stock began trading on the New York Stock Exchange (“NYSE”) on January 18, 2024 under the symbol “PSBD” in connection with our IPO, which closed on January 22, 2024. Prior to our IPO, the shares of our common stock were offered and sold in transactions exempt from registration under the Securities Act. As such, there was no public market for shares of our common stock during the year ended December 31, 2023.
As of the date hereof, none of our shares of common stock are subject to outstanding options or warrants, nor do we have any outstanding equity that is convertible into shares of our common stock. In addition, as of the date hereof, we have not granted any registration rights to any of our stockholders. No stock has been authorized for issuance under any equity compensation plans.
Holders
As of February 26, 2025, we had 117 record holders of our common stock. This number does not include stockholders for whom shares are held in “nominee” or “street name.”
Price Range of Common Stock
The following table sets forth, for each fiscal quarter during the last fiscal year and the current fiscal year to date, the net asset value, or NAV, per share of our common stock, the high and low closing sales prices for our common stock and such sales prices as a percentage of NAV per share.
|
|
|
|
|
|
|
|
|
|
|
|
|
Closing Sale Prices (2) |
|
|
||||
|
NAV (1) |
|
High |
|
Low |
|
Premium/(Discount) |
|
Premium/(Discount) |
Year ended December 31, 2024 |
|
|
|
|
|
|
|
|
|
First Quarter |
$17.16 |
|
$16.76 |
|
$15.95 |
|
(2.3)% |
|
(7.1)% |
Second Quarter |
$16.85 |
|
$16.83 |
|
$15.90 |
|
(0.1)% |
|
(5.6)% |
Third Quarter |
$16.61 |
|
$16.68 |
|
$16.04 |
|
0.4% |
|
(3.4)% |
Fourth Quarter |
$16.50 |
|
$16.30 |
|
$15.20 |
|
(1.2)% |
|
(7.9)% |
Year ending December 31, 2025 |
|
|
|
|
|
|
|
|
|
First Quarter (through February 25, 2025) |
* |
|
$15.98 |
|
$15.15 |
|
* |
|
* |
* Not determinable at the time of filing.
Distributions
The following table reflects the distributions declared on shares during the fiscal year ended December 31, 2024:
Declaration Date |
|
Record Date |
|
Per Share |
|
|
Payment Date |
|
Total Distributions Declared |
|
||
3/20/2024 |
|
3/28/2024 |
|
$ |
0.490 |
|
|
4/10/2024 |
|
$ |
15,950,869 |
|
5/7/2024 |
|
6/28/2024 |
|
|
0.420 |
|
|
7/16/2024 |
|
|
13,678,310 |
|
6/20/2024 |
|
6/28/2024 |
|
|
0.050 |
|
|
7/16/2024 |
|
|
1,628,370 |
|
8/7/2024 |
|
9/27/2024 |
|
|
0.420 |
|
|
10/14/2024 |
|
|
13,702,071 |
|
9/23/2024 |
|
9/27/2024 |
|
|
0.050 |
|
|
10/14/2024 |
|
|
1,631,199 |
|
11/5/2024 |
|
12/27/2024 |
|
|
0.420 |
|
|
1/13/2025 |
|
|
13,693,684 |
|
12/23/2024 |
|
12/27/2024 |
|
|
0.060 |
|
|
1/13/2025 |
|
|
1,956,241 |
|
|
|
|
|
|
|
|
|
|
$ |
62,240,744 |
|
|
45
The following table reflects the distributions declared on shares during the fiscal year ended December 31, 2023:
Declaration Date |
|
Record Date |
|
Per Share |
|
|
Payment Date |
|
Total Distributions Declared |
|
||
5/16/2023 |
|
5/17/2023 |
|
$ |
0.520 |
|
|
5/18/2023 |
|
$ |
13,183,368 |
|
8/14/2023 |
|
8/15/2023 |
|
|
0.540 |
|
|
8/16/2023 |
|
|
13,928,820 |
|
9/29/2023 |
|
9/29/2023 |
|
|
0.560 |
|
|
10/17/2023 |
|
|
14,678,378 |
|
12/20/2023 |
|
12/21/2023 |
|
|
0.535 |
|
|
12/22/2023 |
|
|
14,277,719 |
|
|
|
|
|
|
|
|
|
|
$ |
56,068,285 |
|
|
The following table reflects the distributions declared on shares during the fiscal year ended December 31, 2022:
Declaration Date |
|
Record Date |
|
Per Share |
|
|
Payment Date |
|
Total Distributions Declared |
|
||
5/12/2022 |
|
5/17/2022 |
|
$ |
0.370 |
|
|
5/18/2022 |
|
$ |
8,439,969 |
|
8/11/2022 |
|
8/16/2022 |
|
|
0.440 |
|
|
8/17/2022 |
|
|
10,147,434 |
|
11/10/2022 |
|
11/15/2022 |
|
|
0.440 |
|
|
11/16/2022 |
|
|
10,284,466 |
|
12/30/2022 |
|
12/30/2022 |
|
|
0.640 |
|
|
1/17/2023 |
|
|
15,183,248 |
|
|
|
|
|
|
|
|
|
|
$ |
44,055,117 |
|
|
Distribution Reinvestment Plan
The Company has adopted a dividend reinvestment plan that provides for reinvestment of its dividends and other distributions on behalf of the Company’s stockholders, unless a stockholder elects to receive cash. As a result, if the Company’s Board authorizes, and the Company declares, a cash dividend or other distribution, then stockholders who do not “opt out” of the Company’s dividend reinvestment plan will have their cash dividends and distributions automatically reinvested in additional shares of the Company’s common stock, rather than receiving cash dividends and distributions.
Prior to the IPO, the Board primarily used newly-issued shares of the Company’s common stock to implement the dividend reinvestment plan. The number of shares of common stock to be issued to a participant prior to the IPO would be equal to the quotient determined by dividing the cash value of the dividend payable to such stockholder by the net asset value per share as of the date such dividend was declared.
After the IPO, the Board intends to primarily use newly-issued shares to implement the dividend reinvestment plan, whether or not the shares are trading at a price per share at, below or above net asset value. However, the Board reserves the right to purchase shares in the open market in connection with the implementation of the dividend reinvestment plan. The Board will examine the full facts and circumstances of each such dividend to determine the approach (i.e., to use newly issued shares or effectuate open market purchases to implement the dividend reinvestment plan) that is in the best interests of stockholders taking into account the Board’s fiduciary duties to stockholders, including by weighing the potential dilution in connection with such issuance to be incurred by the Company’s stockholders against the Company’s need and usage of reinvested funds, and, if we use newly issued shares to implement the dividend reinvestment plan at a time when the shares are trading at a price below NAV, the stockholders’ receipt of fewer shares than they would have if we had effectuated open market purchases. The number of newly issued shares to be issued to a participant would be determined by dividing the total dollar amount of the dividend payable to such stockholder by the market price per share of the Company’s common stock at the close of regular trading on a national securities exchange on the dividend payment date. Shares purchased in open market transactions by Equiniti, the plan administrator and the Company’s transfer agent, registrar and dividend disbursing agent, will be allocated to a participant based upon the average purchase price, excluding any brokerage charges or other charges, of all shares of the Company’s common stock purchased with respect to the dividend.
A registered stockholder may elect to receive an entire distribution in cash by notifying Equiniti in writing so that such notice is received by the plan administrator no later than the record date for distributions to stockholders. The plan administrator will set up an account for shares acquired through the plan for each stockholder who has not elected to receive dividends or other distributions in cash and hold such shares in noncertificated form.
There will be no brokerage charges or other charges to stockholders who participate in the plan. The plan administrator’s fees are paid by the Company.
Stockholders who receive dividends and other distributions in the form of stock are generally subject to the same U.S. federal, state and local tax consequences as are stockholders who elect to receive their distributions in cash. However, since a participating stockholder’s cash dividends will be reinvested, such stockholder will not receive cash with which to pay any applicable taxes on reinvested dividends. A stockholder’s basis for determining gain or loss upon the sale of stock received in a dividend or other distribution from the Company will generally be equal to the total dollar amount of the distribution payable to the stockholder. Any stock received in a dividend or other distribution will have a new holding period for tax purposes commencing on the day following the day on which the shares are credited to the U.S. stockholder’s account.
Participants may terminate their accounts under the plan by so notifying the plan administrator by submitting a letter of instruction terminating the participant’s account under the plan to Equiniti. The plan may be terminated by the Company upon notice in writing mailed to each participant at least 30 days prior to any record date for the payment of any dividend by the Company.
If participants withdraw from the plan or the plan is terminated, the plan administrator will cause the shares held for the participant under the plan to be delivered to the participant. If an investor holds common stock with a brokerage firm that does not participate in the plan, such investor will not be able to participate in the plan and any dividend reinvestment may be affected on different terms than those described above.
Stockholders can obtain additional information about the dividend reinvestment plan by contacting Equiniti via telephone at (877) 248-6417 or by mailing a request to Equiniti Trust Company, LLC, 55 Challenger Rd, Ridgefield Park, NJ 07660.
46
Performance Graph
The following graph compares the cumulative total return on our common stock with the cumulative total return of the Standard & Poor's 500 Stock Index ("S&P 500"), Standard & Poor's BDC Index ("S&P BDC Index"), Morningstar LTSA US Leveraged Loan Index ("Leveraged Loan Index"), and the Bloomberg US Corporate High Yield Bond Index ("High Yield Bond Index") for the period January 18, 2024 (the date of our IPO) to December 31, 2024. This comparison assumes $100.00 was invested in our common stock at the closing price of our common stock on January 18, 2024 and in the comparison groups and assumes the reinvestment of all cash dividends on the ex-dividend date prior to any tax effect. The stock price performance shown on the graph below is not necessarily indicative of future price performance.
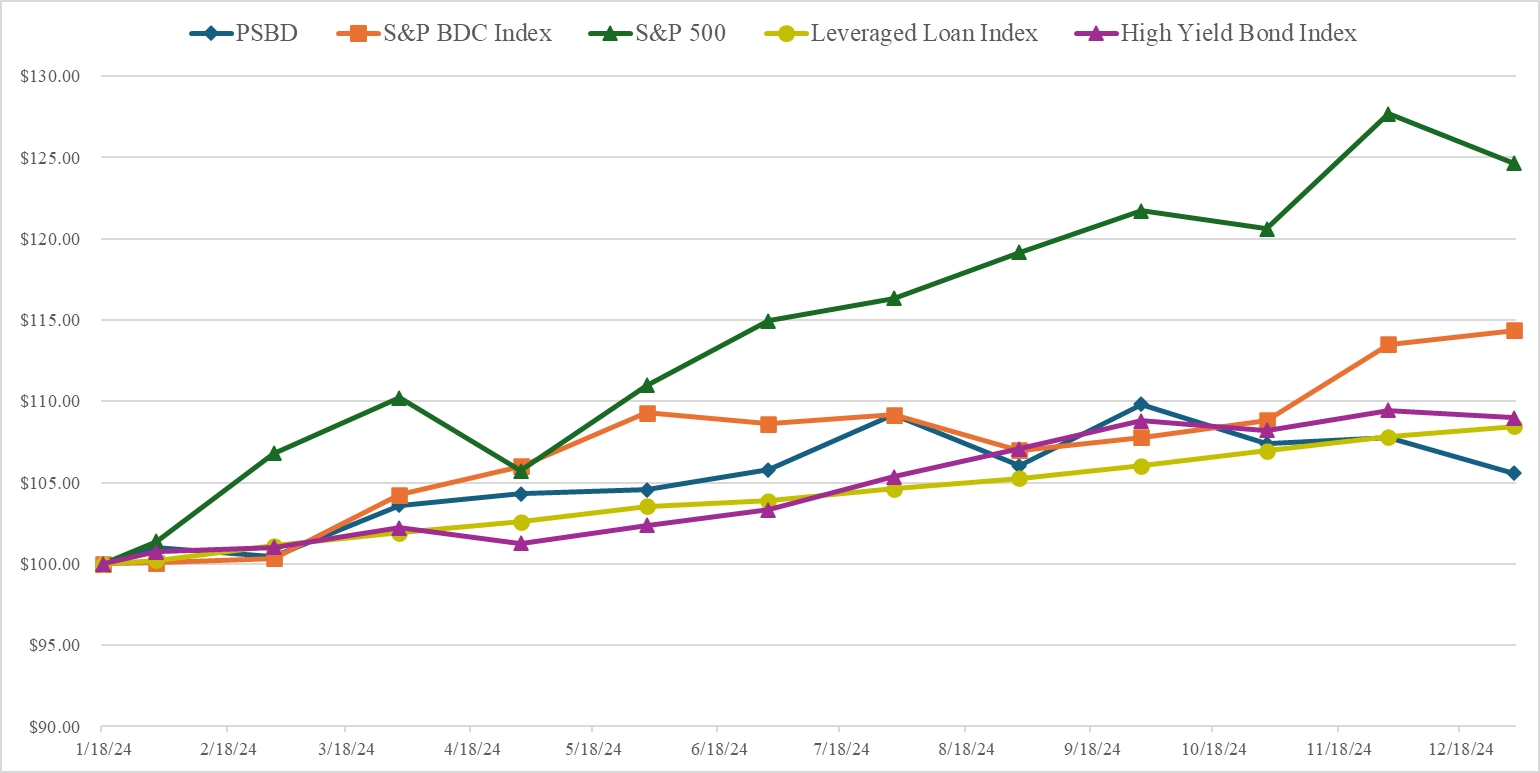
Recent Sales of Unregistered Securities
None.
47
Issuer Purchases of Equity Securities
The following table sets forth information regarding repurchases of our common stock during the year ended December 31, 2024.
Period |
|
Total |
|
Average |
|
Total Number |
|
Maximum (or Approximate Dollar Value) of Shares that may Yet Be Purchased Under the Plans or Programs (Dollars in Thousands) (1) |
April 1, 2024 through April 30, 2024 |
|
17,251 |
|
$16.14 |
|
17,251 |
|
$14,722 |
May 1, 2024 through May 31, 2024 |
|
600 |
|
16.28 |
|
17,851 |
|
14,712 |
June 1, 2024 through June 30, 2024 |
|
3,501 |
|
16.57 |
|
21,352 |
|
14,654 |
July 1, 2024 through July 31, 2024 |
|
8,835 |
|
16.17 |
|
30,187 |
|
14,511 |
August 1, 2024 through August 31, 2024 |
|
- |
|
- |
|
30,187 |
|
14,511 |
September 1, 2024 through September 30, 2024 |
|
477 |
|
16.06 |
|
30,664 |
|
14,503 |
October 1, 2024 through October 31, 2024 |
|
1,930 |
|
15.85 |
|
32,594 |
|
14,473 |
November 1, 2024 through November 30, 2024 |
|
17,185 |
|
15.79 |
|
49,779 |
|
14,201 |
December 1, 2024 through December 31, 2024 |
|
29,185 |
|
15.87 |
|
78,964 |
|
13,738 |
Total |
|
78,964 |
|
$15.98 |
|
78,964 |
|
$13,738 |
ITEM 6. [Reserved]
Not applicable.
48
ITEM 7. MANAGEMENT’S DISCUSSION AND ANALYSIS OF FINANCIAL CONDITION AND RESULTS OF OPERATIONS
The following discussion and analysis should be read in conjunction with our consolidated financial statements and related notes and other financial information appearing elsewhere in this Annual Report on Form 10-K. Except as otherwise specified, references to “we,” “us,” “our,” or the “Company” refer to Palmer Square Capital BDC Inc.
Forward-Looking Statements
This annual report on Form 10-K contains forward-looking statements that involve substantial known and unknown risks, uncertainties and other factors. Undue reliance should not be placed on such statements. These forward-looking statements are not historical facts, but rather are based on current expectations, estimates and projections about our company, our current and prospective portfolio investments, our industry, our beliefs and our assumptions. Words such as “anticipates,” “expects,” “intends,” “plans,” “will,” “may,” “continue,” “believes,” “seeks,” “estimates,” “would,” “could,” “should,” “targets,” “projects,” and variations of these words and similar expressions are intended to identify forward-looking statements. These statements are not guarantees of future performance and are subject to risks, uncertainties and other factors, some of which are beyond our control and difficult to predict and could cause actual results to differ materially from those expressed or forecasted in the forward-looking statements, including:
Although we believe that the assumptions on which these forward-looking statements are based are reasonable, any of the assumptions could prove to be inaccurate, and as a result, the forward-looking statements based on those assumptions also could be inaccurate. In light of these and other uncertainties, the inclusion of a projection or forward-looking statement in this annual report on Form 10-K should not be regarded as a representation by us that our plans and objectives will be achieved. These risks and uncertainties include those described or identified in the section entitled “Item 1A. Risk Factors” and elsewhere in this annual report on Form 10-K. You should not place undue reliance on these forward-looking statements, which apply only as of the date of this annual report on Form 10-K. Moreover, we assume no duty and do not undertake to update the forward-looking statements.
49
Overview
We are a financial services company that primarily lends to and invests in corporate debt securities of companies, including small to large private U.S. companies. We were organized as a Maryland corporation on August 26, 2019 and are structured as an externally managed, non-diversified closed-end management investment company. We have elected to be regulated as a BDC under the 1940 Act and, beginning with our taxable year ended December 31, 2020, we have elected to be treated as a RIC under Subchapter M of the Code, and we expect to qualify as a RIC annually.
On January 22, 2024, we completed our IPO, issuing 5,450,000 shares of common stock, par value $0.001, at a public offering price of $16.45 per share. Our common stock began trading on the New York Stock Exchange under the symbol “PSBD” on January 18, 2024.
We are externally managed by the Investment Advisor, an investment adviser that is registered with the SEC under the Advisers Act, pursuant to the Advisory Agreement. Subject to the supervision of our Board, a majority of which is made up of Independent Directors, our Investment Advisor manages our day-to-day operations and provides us with investment advisory and management services and certain administrative services. The Investment Advisor, in its capacity as Administrator, provides the administrative services necessary for us to operate pursuant to the Administration Agreement. The Administrator has entered into the Sub-Administration Agreement to delegate certain administrative functions to the Sub-Administrator. Our Investment Advisor is a majority-owned subsidiary of PSCM, which is a privately held firm specializing in global alternative (non-traditional) investments with a total return orientation.
Our investment objective is to maximize total return, comprised of current income and capital appreciation. However, no assurance can be given that our investment objective will be achieved, and investment results may vary substantially on a monthly, quarterly and annual basis. The Company’s current investment focus is guided by two strategies that facilitate our investment opportunities and core competencies: (1) investing in corporate debt securities and, to a lesser extent, (2) investing in CLO structured credit funds that typically own corporate debt securities, including the equity and junior debt tranches of CLOs. We seek to invest in credit and other assets that the Investment Advisor believes have strong structural protections, limited downside, and low long-term beta, or volatility, in comparison to systemic risk within the broader credit and equity markets. A significant portion of the loans in which we may invest or obtain exposure to through our investments in structured securities may be deemed “Covenant-Lite Loans,” which means the loans contain fewer or no maintenance covenants compared to other loans and do not include terms which allow the lender to declare a default if certain covenants are breached.
Revenues
We generate revenue primarily in the form of interest and fee income on debt investments we hold and capital gains, if any, on investments. Our debt investments generally bear interest at a floating rate usually determined on the basis of a benchmark. Interest on debt securities is generally payable quarterly or semi-annually. In some instances, we receive payments on our debt investments based on scheduled amortization of the outstanding balances. In addition, we receive repayments of some of our debt investments prior to their scheduled maturity date. The frequency or volume of these repayments is expected to fluctuate significantly from period to period. Our portfolio activity also reflects the proceeds of sales of securities. We may also generate revenue in the form of commitment, origination, amendment, structuring or due diligence fees, fees for providing managerial assistance and consulting fees.
50
Expenses
Our primary operating expenses include the payment of fees to the Investment Advisor under the Advisory Agreement, our allocable portion of overhead and rental expenses under the Administration Agreement and other operating costs described below. We bear all other out-of-pocket costs and expenses of our operations and transactions, including:
Portfolio and Investment Activity
As of December 31, 2024, our weighted average total yield to maturity of debt and income producing securities at fair value was 10.65%, and our weighted average total yield to maturity of debt and income producing securities at amortized cost was 9.06%.
As of December 31, 2023, our weighted average total yield to maturity of debt and income producing securities at fair value was 10.51%, and our weighted average total yield to maturity of debt and income producing securities at amortized cost was 8.93%.
As of December 31, 2024, we had 262 debt and equity investments in 207 portfolio companies with an aggregate fair value of approximately $1.3 billion.
As of December 31, 2023, we had 227 debt and equity investments in 191 portfolio companies with an aggregate fair value of approximately $1.0 billion.
51
Our investment activity for the years ended December 31, 2024, 2023, and 2022 is presented below (information presented herein is at amortized cost unless otherwise indicated).
|
|
For the Year Ended December 31, |
|
|||||||||
|
|
2024 |
|
|
2023 |
|
|
2022 |
|
|||
New investments: |
|
|
|
|
|
|
|
|
|
|||
Gross investments |
|
$ |
773,809,544 |
|
|
$ |
273,733,424 |
|
|
$ |
278,951,054 |
|
Less: sold investments |
|
|
(468,762,595 |
) |
|
|
(247,083,117 |
) |
|
|
(314,355,643 |
) |
Total new investments |
|
|
305,046,949 |
|
|
|
26,650,307 |
|
|
|
(35,404,589 |
) |
|
|
|
|
|
|
|
|
|
|
|||
Principal amount of investments funded: |
|
|
|
|
|
|
|
|
|
|||
First-lien senior secured debt investments |
|
$ |
687,351,131 |
|
|
$ |
267,272,174 |
|
|
$ |
247,233,397 |
|
Second-lien senior secured debt investments |
|
|
46,287,869 |
|
|
|
3,858,750 |
|
|
|
19,102,118 |
|
Corporate bonds |
|
|
4,095,000 |
|
|
|
2,602,500 |
|
|
|
- |
|
Convertible bonds |
|
|
- |
|
|
|
- |
|
|
|
3,728,288 |
|
Collateralized securities and structured products - debt |
|
|
34,817,350 |
|
|
|
- |
|
|
|
- |
|
CLO Equity |
|
|
- |
|
|
|
- |
|
|
|
8,887,251 |
|
Common stock |
|
|
1,258,194 |
|
|
|
- |
|
|
|
- |
|
Total principal amount of investments funded |
|
|
773,809,544 |
|
|
|
273,733,424 |
|
|
|
278,951,054 |
|
|
|
|
|
|
|
|
|
|
|
|||
Principal amount of investments sold or |
|
|
|
|
|
|
|
|
|
|||
First-lien senior secured debt investments |
|
$ |
416,686,491 |
|
|
$ |
233,535,659 |
|
|
$ |
292,852,517 |
|
Second-lien senior secured debt investments |
|
|
24,881,614 |
|
|
|
8,013,549 |
|
|
|
11,938,325 |
|
Corporate Bonds |
|
|
4,020,000 |
|
|
|
- |
|
|
|
987,500 |
|
Convertible bonds |
|
|
- |
|
|
|
- |
|
|
|
4,504,808 |
|
CLO Equity |
|
|
11,174,490 |
|
|
|
2,533,909 |
|
|
|
1,976,080 |
|
Collateralized securities and structured products - debt |
|
|
12,000,000 |
|
|
|
3,000,000 |
|
|
|
1,501,875 |
|
Common Stock |
|
|
- |
|
|
|
- |
|
|
|
594,538 |
|
Total principal amount of investments sold or repaid |
|
$ |
468,762,595 |
|
|
|
247,083,117 |
|
|
|
314,355,643 |
|
Our investment activity for the years ended December 31, 2024 and December 31, 2023 is presented below (information presented herein is at par unless otherwise indicated). New investment commitment refers to long-term funded commitments in new securities made during the year that remained outstanding as of December 31, 2024 and December 31, 2023, respectively.
|
|
For the Year Ended December 31, |
|
|||||||||
|
|
2024 |
|
|
2023 |
|
|
2022 |
|
|||
Number of new investment commitments |
|
|
94 |
|
|
|
67 |
|
|
|
38 |
|
Average new investment commitment amount |
|
$ |
4,419,385 |
|
|
$ |
3,802,624 |
|
|
$ |
4,784,093 |
|
Weighted average maturity for new investment commitments |
|
5.60 years |
|
|
5.19 years |
|
|
5.95 years |
|
|||
Percentage of new debt investment commitments at floating rates |
|
|
100.00 |
% |
|
|
98.82 |
% |
|
|
100.00 |
% |
Percentage of new debt investment commitments at fixed rates |
|
|
0.00 |
% |
|
|
1.18 |
% |
|
|
0.00 |
% |
Weighted average interest rate of new investment commitments(1) |
|
|
9.12 |
% |
|
|
10.22 |
% |
|
|
9.17 |
% |
Weighted average spread over reference rate of new floating rate investment commitments(2) |
|
|
4.62 |
% |
|
|
4.87 |
% |
|
|
4.80 |
% |
Weighted average interest rate on long-term investments sold or paid down |
|
|
9.68 |
% |
|
|
9.56 |
% |
|
|
5.45 |
% |
52
As of December 31, 2024 and December 31, 2023, our investments consisted of the following:
|
|
December 31, 2024 |
|
|
December 31, 2023 |
|
||||||||||
|
|
Amortized |
|
|
Fair |
|
|
Amortized |
|
|
Fair |
|
||||
|
|
Cost |
|
|
Value |
|
|
Cost |
|
|
Value |
|
||||
First-lien senior secured debt |
|
$ |
1,243,362,037 |
|
|
$ |
1,206,603,630 |
|
|
$ |
984,089,538 |
|
|
$ |
952,100,626 |
|
Second-lien senior secured debt |
|
|
84,821,531 |
|
|
|
77,650,130 |
|
|
|
67,449,770 |
|
|
|
55,989,218 |
|
Corporate Bonds |
|
|
4,883,315 |
|
|
|
4,214,315 |
|
|
|
4,495,104 |
|
|
|
4,239,975 |
|
CLO Mezzanine |
|
|
37,827,370 |
|
|
|
38,147,753 |
|
|
|
14,859,567 |
|
|
|
13,764,620 |
|
CLO Equity |
|
|
13,029,085 |
|
|
|
10,003,685 |
|
|
|
24,478,438 |
|
|
|
18,953,309 |
|
Equity |
|
|
1,258,194 |
|
|
|
1,081,497 |
|
|
|
- |
|
|
|
- |
|
Short-term investments |
|
|
69,429,935 |
|
|
|
69,429,935 |
|
|
|
63,763,005 |
|
|
|
63,763,005 |
|
Total Investments |
|
$ |
1,454,611,467 |
|
|
$ |
1,407,130,945 |
|
|
$ |
1,159,135,422 |
|
|
$ |
1,108,810,753 |
|
The table below describes investments by industry composition based on fair value as of December 31, 2024 and December 31, 2023:
|
|
December 31, |
|
|
December 31, |
|
||
Software |
|
|
10.2 |
% |
|
|
14.0 |
% |
Healthcare Providers and Services |
|
|
9.4 |
% |
|
|
9.3 |
% |
Professional Services |
|
|
7.7 |
% |
|
|
7.2 |
% |
IT Services |
|
|
6.7 |
% |
|
|
6.7 |
% |
Chemicals |
|
|
5.1 |
% |
|
|
2.9 |
% |
Insurance |
|
|
5.0 |
% |
|
|
5.9 |
% |
Short-Term Investments |
|
|
4.9 |
% |
|
|
5.8 |
% |
Construction and Engineering |
|
|
4.5 |
% |
|
|
2.6 |
% |
Diversified Financial Services |
|
|
3.9 |
% |
|
|
4.2 |
% |
Independent Power and Renewable Electricity Producers |
|
|
3.3 |
% |
|
|
3.4 |
% |
Hotels, Restaurants and Leisure |
|
|
3.1 |
% |
|
|
4.2 |
% |
Media |
|
|
3.1 |
% |
|
|
3.7 |
% |
Electronic Equipment, Instruments and Components |
|
|
2.8 |
% |
|
|
1.5 |
% |
Structured Note |
|
|
2.7 |
% |
|
|
1.2 |
% |
Diversified Consumer Services |
|
|
2.6 |
% |
|
|
1.6 |
% |
Auto Components |
|
|
2.2 |
% |
|
|
1.7 |
% |
Diversified Telecommunication Services |
|
|
2.2 |
% |
|
|
0.8 |
% |
Internet Software and Services |
|
|
1.9 |
% |
|
|
1.4 |
% |
Food Products |
|
|
1.9 |
% |
|
|
2.0 |
% |
Building Products |
|
|
1.9 |
% |
|
|
2.9 |
% |
Machinery |
|
|
1.8 |
% |
|
|
1.6 |
% |
Energy Equipment and Services |
|
|
1.7 |
% |
|
|
1.4 |
% |
Containers and Packaging |
|
|
1.5 |
% |
|
|
1.7 |
% |
Metals and Mining |
|
|
1.4 |
% |
|
|
1.2 |
% |
Aerospace and Defense |
|
|
0.7 |
% |
|
|
1.2 |
% |
Industrial Conglomerates |
|
|
0.7 |
% |
|
|
0.4 |
% |
Structured Subordinated Note |
|
|
0.7 |
% |
|
|
1.7 |
% |
Interactive Media Services |
|
|
0.7 |
% |
|
|
— |
|
Electrical Equipment |
|
|
0.7 |
% |
|
|
0.5 |
% |
Wireless Telecommunication Services |
|
|
0.7 |
% |
|
|
0.6 |
% |
Real Estate Management and Development |
|
|
0.6 |
% |
|
|
0.6 |
% |
Road and Rail |
|
|
0.6 |
% |
|
|
0.5 |
% |
Healthcare Equipment and Supplies |
|
|
0.6 |
% |
|
|
0.8 |
% |
Commercial Services and Supplies |
|
|
0.6 |
% |
|
|
1.3 |
% |
Pharmaceuticals |
|
|
0.6 |
% |
|
|
0.6 |
% |
Electric Utilities |
|
|
0.6 |
% |
|
|
— |
|
Specialty Retail |
|
|
0.5 |
% |
|
|
0.6 |
% |
Household Durables |
|
|
0.2 |
% |
|
|
0.4 |
% |
Oil, Gas and Consumable Fuels |
|
|
— |
|
|
|
0.9 |
% |
Healthcare Technology |
|
|
— |
|
|
|
1.0 |
% |
Total |
|
|
100.0 |
% |
|
|
100.0 |
% |
|
|
|
|
|
|
|
||
53
The table below shows the weighted average yields and interest rate of our debt investments at fair value as of December 31, 2024 and December 31, 2023:
|
|
December 31, |
|
|
December 31, 2023 |
|
||
Weighted average total yield of debt and income producing securities |
|
|
10.65 |
% |
|
|
10.51 |
% |
Weighted average interest rate of debt and income producing securities(1) |
|
|
8.93 |
% |
|
|
10.10 |
% |
Weighted average spread over reference rate of all floating rate investments (2) |
|
|
4.48 |
% |
|
|
4.61 |
% |
Results of Operations
The following table represents the operating results for the years ended December 31, 2024, 2023, and 2022:
|
|
For the Year Ended December 31, |
|
|||||||||
|
|
2024 |
|
|
2023 |
|
|
2022 |
|
|||
Total investment income |
|
$ |
143,513,299 |
|
|
$ |
112,223,607 |
|
|
$ |
74,499,900 |
|
Less: Net expenses |
|
|
80,912,917 |
|
|
|
54,236,087 |
|
|
|
33,419,068 |
|
Net investment income |
|
|
62,600,382 |
|
|
|
57,987,520 |
|
|
|
41,080,832 |
|
Net realized gains (losses) on investments |
|
|
(17,778,119 |
) |
|
|
(2,715,413 |
) |
|
|
(8,130,187 |
) |
Net change in unrealized gains (losses) on investments |
|
|
2,843,502 |
|
|
|
52,563,544 |
|
|
|
(107,432,980 |
) |
Net increase (decrease) in net assets resulting from operations |
|
$ |
47,665,765 |
|
|
$ |
107,835,651 |
|
|
$ |
(74,482,335 |
) |
Investment Income
Investment income for the years ended December 31, 2024, 2023, and 2022, was as follows:
|
|
For the Year Ended December 31, |
|
|||||||||
|
|
2024 |
|
|
2023 |
|
|
2022 |
|
|||
Interest from investments |
|
$ |
137,508,964 |
|
|
$ |
107,739,382 |
|
|
$ |
73,705,450 |
|
Dividend income |
|
|
3,315,849 |
|
|
|
4,066,745 |
|
|
|
610,203 |
|
Payment-in-kind interest income |
|
|
1,123,611 |
|
|
|
- |
|
|
|
- |
|
Other income |
|
|
1,564,875 |
|
|
|
417,480 |
|
|
|
184,247 |
|
Total investment income |
|
$ |
143,513,299 |
|
|
$ |
112,223,607 |
|
|
$ |
74,499,900 |
|
For the years ended December 31, 2024, 2023, and 2022, total investment income was driven by interest income from our investments. The size of our investment portfolio at fair value decreased from $1.1 billion as of December 31, 2021 to $966.9 million as of December 31, 2022, increased from $966.9 million as of December 31, 2022 to $1.0 billion as of December 31, 2023, and increased from $1.0 billion as of December 31, 2023 to $1.3 billion as of December 31, 2024. All debt and short-term investments were income producing, except for two loans on non-accrual status as of December 31, 2024. As of December 31, 2024, loans on non-accrual status represented 0.08% of the total investments at fair value (or 0.46% at amortized cost). There were no loans on non-accrual status as of December 31, 2023 and December 31, 2022.
54
Expenses
Operating expenses for the years ended December 31, 2024, 2023, and 2022, were as follows:
|
|
For the Year Ended December 31, |
|
|||||||||
|
|
2024 |
|
|
2023 |
|
|
2022 |
|
|||
Interest expense |
|
$ |
58,006,112 |
|
|
$ |
44,483,152 |
|
|
$ |
23,452,169 |
|
Incentive fees |
|
|
8,553,414 |
|
|
|
- |
|
|
|
- |
|
Management fees |
|
|
9,704,528 |
|
|
|
8,408,074 |
|
|
|
8,328,713 |
|
Other operating expenses |
|
|
4,549,374 |
|
|
|
2,320,870 |
|
|
|
2,604,275 |
|
Directors fees |
|
|
150,000 |
|
|
|
75,000 |
|
|
|
75,000 |
|
Management fee waiver |
|
|
(50,511 |
) |
|
|
(1,051,009 |
) |
|
|
(1,041,089 |
) |
Net expenses |
|
$ |
80,912,917 |
|
|
$ |
54,236,087 |
|
|
$ |
33,419,068 |
|
Net expenses for the year ended December 31, 2024 were $80.9 million, which consisted of $58.0 million in interest and debt financing, $8.6 million in incentive fees, $9.7 million in management fees, $4.5 million in other operating expenses, and $150 thousand in directors fees offset by $51 thousand in management fee waiver from the Investment Advisor.
Interest expense increased during the year ended December 31, 2024 compared to the prior year primarily due to the average balance of debt increasing from $629.6 million at December 31, 2023 to $801.0 million at December 31, 2024 (interest rates increased slightly from 6.58% to 6.82% during the same period) under our BoA Credit Facility, WF Credit Facility, CLO Transaction and incentive fees due to the Investment Advisor upon completion of the IPO.
Net expenses for the year ended December 31, 2023 were $54.2 million, which consisted of $44.5 million in interest and debt financing, $8.4 million in management fees, $2.3 million in other operating expenses, and $75 thousand in directors fees offset by $1.1 million in management fee waiver from the Investment Advisor.
Interest expense increased during the year ended December 31, 2023, primarily due to the average balance of debt increasing under our BoA Credit Facility and WF Credit Facility. Average debt outstanding decreased from $667.5 million to $629.6 million for the years ended December 31, 2022 and December 31, 2023, respectively. Management fees increased due to a higher value of average net assets during the period. Average net assets increased from $416.4 million to $420.4 million as of December 31, 2022 and December 31, 2023, respectively.
Net expenses for the year ended December 31, 2022 were $33.4 million, which consisted of $23.5 million in interest and debt financing, $8.3 million in management fees, $2.6 million in other operating expenses, and $75 thousand in directors fees offset by $1.0 million in management fee waiver from the Investment Advisor.
Net Change in Unrealized Gains (Losses) on Investments
We fair value our portfolio investments quarterly and any changes in fair value are recorded as unrealized gains or losses. During the years ended December 31, 2024, 2023, and 2022, net unrealized gains (losses) on our investment portfolio were comprised of the following:
|
|
For the Year Ended December 31, |
|
|||||||||
|
|
2024 |
|
|
2023 |
|
|
2022 |
|
|||
Unrealized gains on investments |
|
$ |
46,779,273 |
|
|
$ |
65,920,976 |
|
|
$ |
1,635,443 |
|
Unrealized (losses) on investments |
|
|
(43,935,771 |
) |
|
|
(13,357,432 |
) |
|
|
(109,068,423 |
) |
Net change in unrealized gains (losses) on investments |
|
$ |
2,843,502 |
|
|
$ |
52,563,544 |
|
|
$ |
(107,432,980 |
) |
The change in unrealized appreciation (depreciation) for the years ended December 31, 2024, 2023, and 2022 totaled $2.8 million, $52.6 million, and $(107.4) million, respectively. For the year ended December 31, 2024, this consisted of net unrealized depreciation of $18.6 million related to existing portfolio investments and net unrealized appreciation of $21.4 million related to exited portfolio investments (a portion of which has been reclassified to realized gains). For the year ended December 31, 2023, this consisted of net unrealized appreciation of $41.1 million related to existing portfolio investments and net unrealized appreciation of $11.5 million related to exited portfolio investments (a portion of which has been reclassified to realized gains). For the year ended December 31, 2022, this consisted of net unrealized depreciation of $106.2 million related to existing portfolio investments and net unrealized depreciation of $1.2 million related to exited portfolio investments (a portion of which has been reclassified to realized gains).
55
Financial Condition, Liquidity and Capital Resources
We anticipate cash to be generated from registered offerings of our common stock and other future offerings of equity and debt securities (including on-balance sheet CLO financings), and cash flows from operations, including interest earned from the temporary investment of cash in cash equivalents, U.S. government securities and other high-quality debt investments that mature in one year or less. On January 14, 2020, our sole stockholder approved the application of the reduced asset coverage requirements in Section 61(a)(2) of the 1940 Act to us effective as of such date. As a result of the reduced asset coverage requirement, we are permitted, under specified conditions, to issue multiple classes of indebtedness and one class of stock senior to our common stock if our asset coverage, as defined in the 1940 Act, is at least equal to 150% immediately after each such issuance. If we are unable to obtain leverage or raise equity capital on terms that are acceptable to us, our ability to grow our portfolio could be substantially impacted. Furthermore, while any indebtedness and senior securities remain outstanding, we may be required to prohibit any distribution to our stockholders or the repurchase of shares unless we meet the applicable asset coverage ratios at the time of the distribution or repurchase. In connection with borrowings, our lenders, including under the BoA Credit Facility and the WF Credit Facility, may require us to pledge assets, investor commitments to fund capital calls and/or the proceeds of those capital calls. In addition, such lenders may ask us to comply with positive or negative covenants that could have an effect on our operations.
During the year ended December 31, 2024, we experienced a net increase in cash and cash equivalents of $649 thousand. During the period, net cash used in operating activities was $200.6 million, primarily as a result of fundings of portfolio investments (excluding investments in short-term investments) of $773.8 million, partially offset by proceeds received from sale of investments of $468.8 million. We funded short-term investments during the period, and as of the end of the period we held $69.4 million in fair value of short-term investments. During the same period, net cash provided by financing activities was $201.2 million, primarily consisting of $300.0 million in proceeds from the CLO Transaction (as defined below), offset by $137.1 million of net repayments under the BoA Credit Facility and WF Credit Facility and distributions paid in cash of $46.6 million, partially increased by proceeds from the issuance of common stock of $89.7 million.
During the year ended December 31, 2023, we experienced a net increase in cash and cash equivalents of $466 thousand. During the period, net cash provided by operating activities was $19.5 million, primarily as a result of proceeds received from sale of investments (excluding investments in short-term money market funds) of $247.1 million, partially offset by fundings of portfolio investments (excluding investments in short-term money market funds) of $273.7 million. We invested in short-term money market funds during the period, and as of the end of the period we held $63.8 million in fair value of short-term money market funds. During the same period, net cash used in financing activities was $19.1 million, primarily consisting of $1.0 million of net repayments under the BoA Credit Facility and WF Credit Facility, $1.8 million of payments of debt issuance costs and distributions paid in cash of $33.9 million, partially offset by proceeds from the issuance of common stock of $17.6 million.
During the year ended December 31, 2022, we experienced a net increase in cash and cash equivalents of $557 thousand. During the period, net cash provided by operating activities was $25.1 million, primarily as a result of proceeds received from sale of investments (excluding investments in short-term money market funds) of $314.4 million, partially offset by fundings of portfolio investments (excluding investments in short-term money market funds) of $279.0 million. We invested in short-term money market funds during the period, and as of the end of the period we held $50.3 million in fair value of short-term money market funds. During the same period, net cash used in financing activities was $24.6 million, primarily consisting of $10.8 million of net repayments under the BoA Credit Facility and WF Credit Facility and distributions paid in cash of $18.8 million, partially offset by proceeds from the issuance of common stock of $5.0 million.
As of December 31, 2024 and December 31, 2023, we had cash and cash equivalents of $2.8 million and $2.1 million, respectively. As of December 31, 2024, we had $172.7 million in undrawn capacity under the BoA Credit Facility and $24.2 million in undrawn capacity under the WF Credit Facility. As of December 31, 2023, we had $221.0 million in undrawn capacity under the BoA Credit Facility and $38.7 million in undrawn capacity under the WF Credit Facility.
As a BDC, we are required to meet a coverage ratio of total assets to total borrowings and other senior securities, which include all of our borrowings and any preferred stock that we may issue in the future, of at least 150%. If this ratio declines below 150%, we cannot incur additional debt and could be required to sell a portion of our investments to repay some debt when it is disadvantageous to do so. As of December 31, 2024, our asset coverage ratio was 167%.
Capital Contributions
During the years ended December 31, 2024, 2023, and 2022, the Company issued and sold 5,576,363 shares at an aggregate purchase price of $91.7 million, 2,816,166 shares at an aggregate purchase price of $46.7 million, and 1,716,297 shares at an aggregate purchase price of $29.2 million, respectively. These amounts include shares issued in reinvestment.
Company Rule 10b5-1 Stock Repurchase Plan
Concurrently with the closing of the IPO, we have entered into a share repurchase plan (the “Company Rule 10b5-1 Repurchase Plan”) to acquire up to $15 million in the aggregate of shares of our common stock, if the market price per share of our common stock is below the most recently reported NAV per share, subject to certain limitations. Under the Company Rule 10b5-1 Stock Repurchase Plan, the agent will increase the volume of purchases made as the price of our common stock declines, subject to volume restrictions. The Company Rule 10b5-1 Repurchase Plan commenced on March 23, 2024 and will terminate upon the earliest to occur of (i) 12 months from the date of the Company Rule 10b5-1 Stock Repurchase Plan, (ii) the end of the trading day on which the aggregate purchase price for all shares purchased under the Company Rule 10b5-1 Stock Repurchase Plan equals $15 million and (iii) the occurrence of certain other events described in the Company Rule 10b5-1 Stock Repurchase Plan.
For the year ended December 31, 2024, we repurchased 78,964 shares of our common stock pursuant to the Company Rule 10b5-1 Repurchase Plan.
56
PSCM Rule 10b5-1 Stock Purchase Plan
In addition, PSCM will purchase up to $5 million in the aggregate of shares of our common stock in the open market within one year of the IPO date if shares of our common stock trade below a specific level of NAV per share following the IPO. Concurrently with the closing of the IPO, PSCM entered into a share repurchase plan (the “PSCM Rule 10b5-1 Stock Purchase Plan”) to permit the purchase of up to $2.5 million shares of our common stock, if the market price per share of our common stock is below the most recently reported NAV per share, subject to certain limitations. The PSCM Rule 10b5-1 Stock Purchase Plan commenced on March 23, 2024 and will terminate upon the earliest to occur of (i) 12 months from the date of the PSCM Rule 10b5-1 Stock Purchase Plan, (ii) the end of the trading day on which the aggregate purchase price for all shares purchased under the PSCM Rule 10b5-1 Stock Purchase Plan equals $2.5 million, and (iii) the occurrence of certain other events described in the PSCM Rule 10b5-1 Stock Purchase Plan.
For the year ended December 31, 2024, PSCM did not repurchase any shares of our common stock pursuant to the PSCM Rule 10b5-1 Stock Purchase Plan.
Financing Arrangements
Bank of America Credit Facility
On February 18, 2020, we, through a special purpose wholly-owned subsidiary, PS BDC Funding, entered into the Credit Agreement with the Lenders, BofA N.A. as the administrative agent and BofA Securities, as Lead Arranger and Sole Book Manager, pursuant to which the Lenders agreed to provide us with a revolving line of credit.
Under the BoA Credit Facility, the Lenders have agreed to extend credit to PS BDC Funding in an aggregate amount up to the Commitment (as defined in the Credit Agreement) amount. The Commitment amount for the BoA Credit Facility is currently $525 million. The Borrowers’ ability to draw under the BoA Credit Facility is scheduled to terminate on February 11, 2028. All amounts outstanding under the BoA Credit Facility are required to be repaid by February 18, 2028. On March 29, 2024, we entered into a fourth amendment to the BoA Credit Facility to, among other things: (i) extend the facility maturity date from February 18, 2025 to February 18, 2028; (ii) update arrangements for the calculation of the fee on unused commitments from 1.30% to a range from 0.50% to 1.40%, depending on the amount of commitments utilized, and (iii) payment of an extension fee.
Prior to February 3, 2023, the loans under the BOA Credit Facility may have been base rate loans or euro currency loans. The base rate loans bore interest at the base rate plus 1.30%, and the eurocurrency rate loans bore interest at 1-month or 3-month LIBOR plus 1.30%. The “base rate” was equal to the highest of (a) the federal funds rate plus 0.50%, (b) the prime rate, and (c) 1-month or 3-month LIBOR. On February 3, 2023, the Company entered into an omnibus amendment to the BoA Credit Facility that, among other things: (i) removed LIBOR transition language and (ii) replaced eurocurrency rate loans with SOFR loans.
As of February 3, 2023, the loans under the BoA Credit Facility may be base rate loans or SOFR loans. The base rate loans will bear interest at the base rate plus 1.40%, and the SOFR loans will bear interest at 1-month SOFR plus 1.40% or 3-month SOFR plus 1.45%. The “base rate” will be equal to the highest of (a) the federal funds rate plus 0.50%, (b) the prime rate, and (c) 1-month or 3-month SOFR plus 0.10%. The Credit Agreement includes fallback language in the event that SOFR becomes unavailable. Interest pursuant to base rate loans is payable quarterly in arrears, and interest pursuant to SOFR loans is payable either quarterly or monthly, as specified by the Borrowers in a loan notice pertaining thereto. The Credit Agreement requires the payment of a commitment fee of 0.50% for unused Commitments until the four-month anniversary of the Second Amendment to the Credit Agreement. Thereafter, the commitment fee is 0.50% on unused Commitments up to 30% of the BoA Credit Facility, and 1.30% on unused Commitments in excess of 30% of the BoA Credit Facility. Such fee is payable quarterly in arrears. The advance rate for PS BDC Funding’s Eligible Collateral Assets ranges from 40% for Second Lien Bank Loans to 70% for First Lien Bank Loans that are B Assets to 100% for Cash (excluding Excluded Amounts) (as each such term is defined in the Credit Agreement).
PS BDC Funding has pledged all of its assets to BofA N.A., in its capacity as Administrative Agent, to secure its obligations under the BoA Credit Facility. Both the Company and PS BDC Funding have made customary representations and warranties and are required to comply with various covenants, reporting requirements, and other customary requirements for similar credit facilities. Borrowing under the BoA Credit Facility is subject to the leverage restrictions contained in the 1940 Act and PS BDC Funding complies with 1940 Act provisions relating to affiliated transactions and custody (Section 17, as modified by Section 57, of the 1940 Act). The custodian of the assets pledged to BofA N.A. pursuant to the BoA Credit Facility is U.S. Bank. The obligations under the Credit Agreement may be accelerated upon the occurrence of an event of default under the Credit Agreement, including in the event of a change of control of PS BDC Funding or if the Investment Advisor ceases to serve as investment adviser to the Company.
As of December 31, 2024, we had $352.3 million principal outstanding and $172.7 million of available Commitments under the BoA Credit Facility, and PS BDC Funding was in compliance with the applicable covenants in the BoA Credit Facility on such date.
Wells Fargo Credit Facility
On December 18, 2020, we, through a special purpose wholly-owned subsidiary, PS BDC Funding II, entered into the Loan Agreement with the WF Lenders, WFB as the administrative agent and U.S. Bank, as Collateral Agent and Custodian, pursuant to which the WF Lenders agreed to provide us with a line of credit.
On December 18, 2023, we entered into the WF Credit Facility Fourth Amendment, which amends the WF Credit Facility to, among other things: (i) increase the amount available for borrowing under the WF Credit Facility from $150,000,000 to $175,000,000, (ii) extend the facility maturity date from December 18, 2025 to December 18, 2028 and (iii) extend the reinvestment period from December 18, 2023 to December 18, 2026 (subject to other provisions of the WF Credit Facility).
57
Prior to April 10, 2023, the loans under the WF Credit Facility may have been Broadly Syndicated Loans or Middle Market loans and were eurocurrency rate loans unless such rate was unavailable, in which case the loans were base rate loans until such rate was available. Broadly Syndicated Loans bore interest at the LIBOR or base rate, as applicable, plus 1.85%, and Middle Market Loans bore interest at LIBOR or base rate, as applicable, plus 2.35%. The “base rate” was equal to the highest of (a) the federal funds rate plus 0.50% and (b) the prime rate. On April 10, 2023, the Company entered into an amendment to the WF Credit Facility that, among other things: (i) transferred and assigned U.S. Bank National Association’s rights and obligations as collateral agent and as a secured party to U.S. Bank Trust Company, National Association, (ii) referenced SOFR instead of LIBOR and (iii) removed LIBOR transition language.
As of April 10, 2023, the loans under the WF Credit Facility may be Broadly Syndicated Loans or Middle Market Loans and will bear interest at Daily Simple SOFR or base rate (to the extent Daily Simple SOFR is unavailable), plus 2.50%, with an interest rate floor of 0.0%. The “base rate” will be equal to the highest of (a) the federal funds rate plus 0.50% and (b) the prime rate. The Loan Agreement includes fallback language in the event that Daily Simple SOFR becomes unavailable. Interest is payable quarterly, as determined by the WFB as the administrative agent. Following an amendment to the WF Credit Facility on October 13, 2021, the Loan Agreement requires the payment of a non-usage fee of (x) during the first thirteen months following the closing of the WF Credit Facility, 0.50% multiplied by daily unused Facility Amounts, (y) between thirteen and sixteen months following the closing of the WF Credit Facility, 0.50% multiplied by the lesser of (1) daily unused Facility Amounts and (2) 50% of the Facility Amount plus 2.00% multiplied by the greater of (i) the difference between the daily unused Facility Amount and 50% of the Facility Amount and (ii) zero, and, (z) thereafter, 0.50% multiplied by the lesser of (1) daily unused Facility Amounts and (2) 20% of the Facility Amount plus 2.00% multiplied by the greater of (i) the difference between the daily unused Facility Amount and 20% of the Facility Amount and (ii) zero. Such fee is payable quarterly in arrears. The WF Credit Facility includes the option to downsize the facility by paying a Commitment Reduction Fee. The Fee is equal to 2.00% of the facility reduction amount prior to the one-year anniversary of the WF Credit Facility Fourth Amendment, and 1.00% thereafter. The applicable percentage for the advance rate on PS BDC Funding II’s Eligible Loans ranges from 67.5% for Middle Market Loans to 70% for Broadly Syndicated Loans (as each such term is defined in the Loan Agreement).
PS BDC Funding II has pledged all of its assets to U.S. Bank, in its capacity as Collateral Agent, to secure its obligations under the WF Credit Facility and U.S. Bank acts as the custodian of such assets. Both the Company and PS BDC Funding II have made customary representations and warranties and are required to comply with various covenants, reporting requirements, and other customary requirements for similar credit facilities. Borrowing under the WF Credit Facility is subject to the leverage restrictions contained in the 1940 Act and PS BDC Funding II complies with 1940 Act provisions relating to affiliated transactions and custody (Section 17, as modified by Section 57, of the 1940 Act). The obligations under the Loan Agreement may be accelerated upon the occurrence of an event of default under the Loan Agreement, including in the event of a change of control of PS BDC Funding II, if the Investment Advisor ceases to serve as investment adviser to the Company, or if PSCM or its affiliates cease to directly or indirectly own a majority of the membership interests of the Investment Advisor.
As of December 31, 2024, we had $150.8 million outstanding and $24.2 million of available Commitments under the WF Credit Facility, and PS BDC Funding II was in compliance with the applicable covenants in the WF Credit Facility on such date.
CLO Transaction
On May 23, 2024, we completed a $400.5 million term debt securitization (the “CLO Transaction”), also known as a collateralized loan obligation (“CLO”), in connection with which our wholly-owned indirect subsidiary issued the Notes (as defined below). The CLO Transaction functions as a source of long-term balance sheet financing for a portion of our portfolio investments and, as a result, the Notes issued in connection with the CLO Transaction are subject to our regulatory asset coverage requirement.
The notes offered in the CLO Transaction were issued by Palmer Square BDC CLO 1, Ltd. (the “Issuer”), an exempted company incorporated with limited liability under the laws of the Cayman Islands and our wholly-owned subsidiary, and consist of (i) $232 million of Class A Notes (the “Class A Notes”); (ii) $58 million of Class B-1 Notes, (the “Class B-1 Notes”); and (iii) $10 million of Class B-2 Notes (the “Class B-2 Notes” and, together with the Class A Notes and the Class B-1 Notes, the “Secured Notes”). Additionally, the Issuer issued $100.5 million of Subordinated Notes (the “Subordinated Notes”), which do not bear interest but are entitled to all of the principal and interest payments made on the loan portfolio held by the Issuer, net of interest and principal payments distributed to the holders of the Secured Notes. The Secured Notes together with the Subordinated Notes are collectively referred to herein as the “Notes.”
The CLO Transaction is backed by a diversified portfolio of senior secured loans or participation interests therein with the potential for investment in second lien loans or participation interests therein, corporate bonds or loans made to a debtor-in-possession pursuant to Section 364 of the Bankruptcy Code having the priority allowed by either Section 364(c) or 364(d) of the Bankruptcy Code and fully secured by senior liens or participation interests therein, which is managed by us as collateral manager pursuant to a collateral management agreement entered into with the Issuer (the “Collateral Management Agreement”). We have agreed to irrevocably waive all collateral management fees payable to us so long as we are the collateral manager under the Collateral Management Agreement. The Notes are scheduled to mature on July 15, 2037; however, the Notes may be redeemed by the Issuer, at the written direction of (i) a majority of the Subordinated Notes (with the consent of us, in the case of the Secured Notes) or (ii) us, in each case, on any business day on or after July 15, 2026.
As of December 31, 2024, we had outstanding indebtedness under the CLO Transaction of $300.0 million.
58
Distribution Policy
To the extent that we have income available, we intend to distribute quarterly dividends to our stockholders. Our quarterly dividends, if any, will be determined by our Board. Any dividends to our stockholders will be declared out of assets legally available for distribution.
We have elected to be treated, and intend to operate in a manner so as to continuously qualify, as a RIC under the Code. To obtain and maintain RIC tax treatment, among other things, we must distribute dividends to our stockholders in respect of each taxable year of an amount at least equal to 90% of the sum of our net ordinary income and net short-term capital gains in excess of our net long-term capital losses (“investment company taxable income”), determined without regard to any deduction for dividends paid. In order to avoid certain excise taxes imposed on RICs, we currently intend to distribute dividends to our stockholders in respect of each calendar year of an amount at least equal to the sum of: (1) 98% of our net ordinary income (taking into account certain deferrals and elections) for such calendar year; (2) 98.2% of our capital gains in excess of capital losses (“capital gain net income”), adjusted for certain ordinary losses, generally for the one-year period ending on October 31 of such calendar year; and (3) any net ordinary income and capital gain net income for preceding years that were not distributed during such years and on which we previously paid no U.S. federal income tax. Under certain applicable provisions of the Code and U.S. Treasury regulations, distributions payable in cash or in shares of stock at the election of the stockholders are treated as taxable dividends. The Internal Revenue Service has published guidance indicating that this rule will apply even where the total amount of cash that may be distributed is limited to no more than 20% of the total distribution. Under this guidance, if too many stockholders elect to receive their distributions in cash, the cash available for distribution must be allocated among the stockholders electing to receive cash (with the balance of the distribution paid in stock). If we decide to make any distributions consistent with this guidance that are payable in part in stock, taxable stockholders receiving such dividends will be required to include the full amount of the dividend (whether received in cash, shares of our stock, or a combination thereof) as ordinary income (or as long-term capital gain to the extent such distribution is properly reported as a capital gain dividend) to the extent of our current and accumulated earnings and profits for U.S. federal income tax purposes. As a result, a U.S. stockholder may be required to pay tax with respect to such dividends in excess of any cash received. If a U.S. stockholder sells the stock it receives in order to pay this tax, the sales proceeds may be less than the amount included in income with respect to the dividend, depending on the value of our stock at the time of the sale. Furthermore, with respect to non-U.S. stockholders, the Company may be required to withhold U.S. tax with respect to such dividends, including in respect of all or a portion of such dividend that is payable in stock.
For these excise tax purposes, we will be deemed to have distributed any net ordinary taxable income or capital gain net income on which we have paid U.S. federal income tax. Depending on the level of taxable income earned in a calendar year, we may choose to carry forward taxable income for distribution in the following calendar year, and pay any applicable U.S. federal excise tax. We may not be able to achieve results that will permit the payment of cash distributions.
We currently intend to distribute net capital gains (i.e., net long-term capital gains in excess of net short-term capital losses), if any, at least annually out of the assets legally available for such distributions. However, we may decide in the future to retain such capital gains for investment, incur a corporate-level tax on such capital gains, and elect to treat such capital gains as deemed distributions to our stockholders. If this happens, our stockholders will be treated for U.S. federal income tax purposes as if they had received an actual distribution of the capital gains that we retain and reinvested the net after tax proceeds in us. In this situation, our stockholders would be eligible to claim a tax credit equal to their allocable share of the tax we paid on the capital gains deemed distributed to them. We may not be able to achieve operating results that will permit us to pay any cash distributions, and if we issue senior securities, we will be prohibited from making distributions if doing so would cause us to fail to maintain the asset coverage ratios stipulated by the 1940 Act or if such distributions are limited by the terms of any of our borrowings.
We have adopted a dividend reinvestment plan that provides for reinvestment of our dividends and other distributions on behalf of our stockholders, unless a stockholder elects to receive cash. As a result, if our Board authorizes, and we declare, a cash dividend or other distribution, then stockholders who do not “opt out” of the Company’s dividend reinvestment plan will have their cash dividends and distributions automatically reinvested in additional shares of our common stock, rather than receiving cash dividends and distributions.
Prior to the IPO, the Board primarily used newly-issued shares of our common stock to implement the dividend reinvestment plan. The number of shares of common stock to be issued to a participant prior to the IPO would be equal to the quotient determined by dividing the cash value of the dividend payable to such stockholder by the NAV per share as of the date such dividend was declared.
After the IPO, the Board intends to primarily use newly-issued shares to implement the dividend reinvestment plan, whether or not the shares are trading at a price per share at, below or above NAV. However, the Board reserves the right to purchase shares in the open market in connection with the implementation of the dividend reinvestment plan. The Board will examine the full facts and circumstances of each such dividend to determine the approach (i.e., to use newly issued shares or effectuate open market purchases to implement the dividend reinvestment plan) that is in the best interests of stockholders taking into account the Board’s fiduciary duties to stockholders, including by weighing the potential dilution in connection with such issuance to be incurred by our stockholders against our need and usage of reinvested funds, and, if we use newly issued shares to implement the dividend reinvestment plan at a time when the shares are trading at a price below NAV, the stockholders’ receipt of fewer shares than they would have if we had effectuated open market purchases. The number of newly issued shares to be issued to a participant would be determined by dividing the total dollar amount of the dividend payable to such stockholder by the market price per share of our common stock at the close of regular trading on a national securities exchange on the dividend payment date. Shares purchased in open market transactions by Equiniti, the plan administrator and our transfer agent, registrar, and dividend disbursing agent, will be allocated to a participant based upon the average purchase price, excluding any brokerage charges or other charges, of all shares of our common stock purchased with respect to the dividend.
A registered stockholder may elect to receive an entire distribution in cash by notifying Equiniti in writing so that such notice is received by the plan administrator no later than the record date for distributions to stockholders. The plan administrator will set up an account for shares acquired through the plan for each stockholder who has not elected to receive dividends or other distributions in cash and hold such shares in noncertificated form.
59
Critical Accounting Estimates
Our consolidated financial statements are prepared in conformity with accounting principles generally accepted in the United States of America, which requires us to make estimates and assumptions that affect the reported amounts of assets and liabilities at the date of the consolidated financial statements and the reported amounts of revenues and expenses during the reporting periods.
Critical accounting estimates are those that require the application of management’s most difficult, subjective, or complex judgments, often because of the need to make estimates about the effect of matters that are inherently uncertain and that may change in subsequent periods. The preparation of these financial statements will require management to make estimates and assumptions that affect the reported amounts of assets, liabilities, revenues and expenses. Changes in the economic environment, financial markets and any other parameters used in determining such estimates could cause actual results to differ. In addition to the discussion below, we have described our critical accounting estimates in the notes to our consolidated financial statements.
Valuation of Portfolio Investments
In December 2020, the SEC adopted Rule 2a-5 under the 1940 Act, which permits a BDC’s board of directors to either (i) choose to continue to determine fair value in good faith, or (ii) designate its investment adviser as the valuation designee tasked with determining fair value in good faith, subject to the board’s oversight. Our Board has designated the Investment Advisor to serve as our valuation designee effective August 11, 2022.
Under procedures established by our Board, we value investments for which market quotations are readily available at such market quotations. Assets listed on an exchange will be valued at their last sales prices as reported to the consolidated quotation service at 4:00 P.M. Eastern Time on the date of determination. If no such sales of such securities occurred, such securities will be valued at the mean between the last available bid and ask prices as reported by an independent, third-party pricing service on the date of determination (unless the prices provided by the pricing service is believed by the Investment Advisor to be unreliable or a significant event has occurred subsequent to the provision of the prices that the Investment Advisor determines will affect the fair value of the securities). Debt and equity securities that are not publicly traded or whose market prices are not readily available (or for which either of the events noted in the parenthetical immediately above occur) are valued at fair value by the Investment Advisor. Such determination of fair values may involve subjective judgments and estimates, although we will also engage independent valuation providers to review the valuation of each portfolio investment that constitutes a material portion of our portfolio and that does not have a readily available market quotation at least once annually. With respect to unquoted securities, our Investment Advisor will value each investment considering, among other measures, discounted cash flow models, comparisons of financial ratios of peer companies that are public and other factors. With respect to Level 3 assets, we intend to retain one or more independent providers of financial advisory services to assist the Investment Advisor by performing certain limited third-party valuation services. We may appoint additional or different third-party valuation firms in the future.
When an external event such as a purchase transaction, public offering or subsequent equity sale occurs with respect to a fair-valued portfolio company or comparable company, the Investment Advisor will use the pricing indicated by the external event in connection with its fair valuation determination process. Because we expect that there will not be a readily available market for many of the investments in our portfolio, we expect to value many of our portfolio investments at fair value as determined in good faith by the Investment Advisor using a documented valuation policy and a consistently applied valuation process. Due to the inherent uncertainty of determining the fair value of investments that do not have a readily available market value, the fair value of our investments may differ significantly from the values that would have been used had readily available market quotations existed for such investments, and the differences could be material.
Net Realized Gains or Losses and Net Change in Unrealized Appreciation or Depreciation
We measure realized gains or losses by the difference between the net proceeds from the repayment or sale and the amortized cost basis of the investment, without regard to unrealized appreciation or depreciation previously recognized, but considering unamortized upfront fees and prepayment penalties. Net change in unrealized appreciation or depreciation reflects the change in portfolio investment values during the reporting period, including any reversal of previously recorded unrealized appreciation or depreciation, when gains or losses are realized. Realized gains and losses from securities transactions and unrealized appreciation and depreciation of securities are determined using the identified cost basis method for financial reporting.
Related Party Transactions
We have entered into the Advisory Agreement with the Investment Advisor and the Administration Agreement with the Investment Advisor (in such capacity, the Administrator). Mr. Christopher D. Long and Mr. Jeffrey D. Fox, each an executive officer of ours and an interested member of our Board, and Angie K. Long, Matthew L. Bloomfield and Scott A. Betz, each an executive officer of ours, have an indirect pecuniary interest in the Investment Advisor. The Investment Advisor is a registered investment adviser under the Advisers Act that is majority-owned by PSCM. See “Note 3. Agreements and Related Party Transactions – Administration Agreement” and “– Investment Advisory Agreement” in the notes to the accompanying consolidated financial statements.
Contractual Obligations
We have certain contracts under which we have material future commitments. We have entered into the Advisory Agreement with the Investment Advisor in accordance with the 1940 Act. Payments for investment advisory services under the Advisory Agreement are equal to (a) a base management fee calculated at an annual rate of 1.75% of the average value of the weighted average of our total net assets at the end of the two most recently completed quarters and (b) an incentive fee based on our performance. The Investment Advisor agreed to waive its right to receive management fees in excess of 1.75% of the total net assets during any period prior to the IPO. We have entered into an Administration Agreement with the Administrator to serve as our administrator. Pursuant to the Administration Agreement, the Administrator furnishes us with office facilities and equipment, provides us with clerical, bookkeeping and recordkeeping services at such facilities, and provides us with other services necessary for us to operate or has engaged a third-party firm to perform some or all of these functions.
60
A summary of our significant contractual payment obligations related to the repayment of our outstanding indebtedness at December 31, 2024 is as follows:
|
|
Contractual Obligations Payments Due by Period |
|
|||||||||||||||||
|
|
Less than |
|
|
1-3 years |
|
|
3-5 years |
|
|
More than |
|
|
Total |
|
|||||
BoA Credit Facility, Net |
|
$ |
- |
|
|
$ |
- |
|
|
$ |
350,123,183 |
|
|
$ |
- |
|
|
$ |
350,123,183 |
|
WF Credit Facility, Net |
|
|
- |
|
|
|
- |
|
|
|
151,527,419 |
|
|
|
- |
|
|
$ |
151,527,419 |
|
CLO Transaction, Net |
|
|
- |
|
|
|
- |
|
|
|
- |
|
|
|
302,505,057 |
|
|
$ |
302,505,057 |
|
Total contractual obligations |
|
$ |
- |
|
|
$ |
- |
|
|
$ |
501,650,602 |
|
|
$ |
302,505,057 |
|
|
$ |
804,155,659 |
|
Off-Balance Sheet Arrangements
Unfunded commitments to provide funds to portfolio companies are not recorded on our consolidated statements of assets and liabilities. Our unfunded commitments may be significant from time to time. Unfunded commitments may expire without being drawn upon and the total commitment amount does not necessarily represent future cash requirements. As of December 31, 2024 and December 31, 2023, we had 26 unfunded commitments totaling $21.6 million and 15 unfunded commitments totaling $20.1 million, respectively. See “Note 9. Commitments and Contingencies” in the notes to the accompanying consolidated financial statements for specific identification of the unfunded commitments. We believe we maintain sufficient liquidity in the form of cash (including restricted cash, if any), receivables and borrowing capacity to fund these unfunded commitments should the need arise. See Financial Condition, Liquidity and Capital Resources above.
Other than contractual commitments and other legal contingencies incurred in the normal course of our business, we do not have any off-balance sheet financings or liabilities.
ITEM 7A. QUANTITATIVE AND QUALITATIVE DISCLOSURES ABOUT MARKET RISK
We are subject to financial market risks, including changes in interest rates. Interest rate sensitivity refers to the change in our earnings that may result from changes in the level of interest rates. Because we fund a portion of our investments with borrowings, our net investment income will be affected by the difference between the rate at which we invest and the rate at which we borrow. As a result, there can be no assurance that a significant change in market interest rates will not have a material adverse effect on our net investment income.
Assuming that the consolidated statements of assets and liabilities as of December 31, 2024 were to remain constant and that we took no actions to alter our existing interest rate sensitivity, the following table shows the annualized impact of hypothetical base rate changes in interest rate.
Change in Interest Rates |
|
Increase |
|
|
Increase (Decrease) |
|
|
Net Increase (Decrease) |
|
|||
Down 300 basis points |
|
$ |
(41,508,891 |
) |
|
$ |
(24,093,153 |
) |
|
$ |
(17,415,738 |
) |
Down 200 basis points |
|
|
(27,567,766 |
) |
|
|
(16,062,102 |
) |
|
|
(11,505,664 |
) |
Down 100 basis points |
|
|
(13,778,516 |
) |
|
|
(8,031,051 |
) |
|
|
(5,747,465 |
) |
Up 100 basis points |
|
|
13,778,516 |
|
|
|
8,031,051 |
|
|
|
5,747,465 |
|
Up 200 basis points |
|
|
27,567,766 |
|
|
|
16,062,102 |
|
|
|
11,505,664 |
|
Up 300 basis points |
|
|
41,508,891 |
|
|
|
24,093,153 |
|
|
|
17,415,738 |
|
The data in the table are based on our current statements of assets and liabilities. As of December 31, 2024, the Company had $59.7 million in net purchases that had not yet settled and $21.6 million in unfunded commitments. After settlement of these purchases, the change in interest expense will be larger as a result of the increase in the amount borrowed under the BoA Credit Facility, WF Credit Facility or CLO Transaction, as applicable. The table does not include any change in dividend income from our money market investments.
In addition, any investments we make that are denominated in a foreign currency will be subject to risks associated with changes in currency exchange rates. These risks include the possibility of significant fluctuations in the foreign currency markets, the imposition or modification of foreign exchange controls, and potential illiquidity in the secondary market. These risks will vary depending upon the currency or currencies involved.
We measure exposure to interest rate and currency exchange rate fluctuations on an ongoing basis and may hedge against interest rate and currency exchange rate fluctuations by using standard hedging instruments such as futures, options, swaps and forward contracts and credit hedging contracts, such as credit default swaps, in each case, subject to the requirements of the 1940 Act. While hedging activities may insulate us against adverse changes in interest rates, they may also limit our ability to participate in benefits of lower interest rates with respect to our portfolio of investments with fixed interest rates.
61
ITEM 8. FINANCIAL STATEMENTS AND SUPPLEMENTARY DATA
Index to Consolidated Financial Statements
F-1
Report of Independent Registered Public Accounting Firm
To the Board of Directors and Stockholders of Palmer Square Capital BDC Inc.
Opinion on the Financial Statements
We have audited the accompanying consolidated statements of assets and liabilities, including the consolidated schedules of investments, of Palmer Square Capital BDC Inc. and its subsidiaries (the “Company”) as of December 31, 2024 and 2023, and the related consolidated statements of operations, changes in net assets and cash flows for each of the three years in the period ended December 31, 2024, including the related notes (collectively referred to as the “consolidated financial statements”). In our opinion, the consolidated financial statements present fairly, in all material respects, the financial position of the Company as of December 31, 2024 and 2023, and the results of its operations, changes in its net assets and its cash flows for each of the three years in the period ended December 31, 2024 in conformity with accounting principles generally accepted in the United States of America.
Basis for Opinion
These consolidated financial statements are the responsibility of the Company’s management. Our responsibility is to express an opinion on the Company’s consolidated financial statements based on our audits. We are a public accounting firm registered with the Public Company Accounting Oversight Board (United States) (PCAOB) and are required to be independent with respect to the Company in accordance with the U.S. federal securities laws and the applicable rules and regulations of the Securities and Exchange Commission and the PCAOB.
We conducted our audits of these consolidated financial statements in accordance with the standards of the PCAOB. Those standards require that we plan and perform the audits to obtain reasonable assurance about whether the consolidated financial statements are free of material misstatement, whether due to error or fraud. The Company is not required to have, nor were we engaged to perform, an audit of its internal control over financial reporting. As part of our audit we are required to obtain an understanding of internal control over financial reporting but not for the purpose of expressing an opinion on the effectiveness of the Company's internal control over financial reporting. Accordingly, we express no such opinion.
Our audits included performing procedures to assess the risks of material misstatement of the consolidated financial statements, whether due to error or fraud, and performing procedures that respond to those risks. Such procedures included examining, on a test basis, evidence regarding the amounts and disclosures in the consolidated financial statements. Our audits also included evaluating the accounting principles used and significant estimates made by management, as well as evaluating the overall presentation of the consolidated financial statements. Our procedures included confirmation of securities owned as of December 31, 2024 and 2023 by correspondence with the custodian, brokers and agent banks. We believe that our audits provide a reasonable basis for our opinion.
/s/
February 27, 2025
We have served as the Company’s auditor since 2019.
PCAOB ID:
F-2
PART I—FINANCIAL INFORMATION
Item 1. Consolidated Financial Statements.
Palmer Square Capital BDC Inc.
Consolidated Statements of Assets and Liabilities
|
|
December 31, |
|
|
December 31, |
|
||
Assets: |
|
|
|
|
|
|
||
Non-controlled, non-affiliated investments, at fair value (amortized cost of $ |
|
$ |
|
|
$ |
|
||
Cash and cash equivalents |
|
|
|
|
|
|
||
Receivables: |
|
|
|
|
|
|
||
Receivable for sales of investments |
|
|
|
|
|
|
||
Receivable for paydowns of investments |
|
|
|
|
|
|
||
Due from investment adviser |
|
|
|
|
|
|
||
Dividend receivable |
|
|
|
|
|
|
||
Interest receivable |
|
|
|
|
|
|
||
Prepaid expenses and other assets |
|
|
|
|
|
|
||
Total Assets |
|
$ |
|
|
$ |
|
||
|
|
|
|
|
|
|
||
Liabilities: |
|
|
|
|
|
|
||
Credit facilities (net of deferred financing costs of $ |
|
$ |
|
|
$ |
|
||
Notes (net of deferred financing costs of $ |
|
|
|
|
|
|
||
Payables: |
|
|
|
|
|
|
||
Payable for investments purchased |
|
|
|
|
|
|
||
Distributions payable |
|
|
|
|
|
|
||
Management fee payable |
|
|
|
|
|
|
||
Incentive fee payable |
|
|
|
|
|
|
||
Accrued other general and administrative expenses |
|
|
|
|
|
|
||
Total Liabilities |
|
$ |
|
|
$ |
|
||
|
|
|
|
|
|
|
||
|
|
|
|
|
|
|||
|
|
|
|
|
|
|
||
Net Assets: |
|
|
|
|
|
|
||
Common Shares, $ |
|
$ |
|
|
$ |
|
||
Additional paid-in capital |
|
|
|
|
|
|
||
Total distributable earnings (accumulated deficit) |
|
|
( |
) |
|
|
( |
) |
Total Net Assets |
|
$ |
|
|
$ |
|
||
Total Liabilities and Net Assets |
|
$ |
|
|
$ |
|
||
Net Asset Value Per Common Share |
|
$ |
|
|
$ |
|
||
The accompanying notes are an integral part of these consolidated financial statements.
F-3
Palmer Square Capital BDC Inc.
Consolidated Statements of Operations
|
|
For the Year Ended December 31, |
|
|||||||||
|
|
2024 |
|
|
2023 |
|
|
2022 |
|
|||
Income: |
|
|
|
|
|
|
|
|
|
|||
Investment income from non-controlled, non-affiliated investments: |
|
|
|
|
|
|
|
|
|
|||
Interest income |
|
$ |
|
|
$ |
|
|
$ |
|
|||
Dividend income |
|
|
|
|
|
|
|
|
|
|||
Payment-in-kind interest income |
|
|
|
|
|
|
|
|
|
|||
Other income |
|
|
|
|
|
|
|
|
|
|||
Total investment income from non-controlled, non-affiliated investments |
|
|
|
|
|
|
|
|
|
|||
Total Investment Income |
|
|
|
|
|
|
|
|
|
|||
|
|
|
|
|
|
|
|
|
|
|||
Expenses: |
|
|
|
|
|
|
|
|
|
|||
Incentive fees |
|
|
|
|
|
|
|
|
|
|||
Interest expense |
|
|
|
|
|
|
|
|
|
|||
Management fees |
|
|
|
|
|
|
|
|
|
|||
Professional fees |
|
|
|
|
|
|
|
|
|
|||
Directors fees |
|
|
|
|
|
|
|
|
|
|||
Other general and administrative expenses |
|
|
|
|
|
|
|
|
|
|||
Total Expenses |
|
|
|
|
|
|
|
|
|
|||
Less: Management fee waiver (Note 3) |
|
|
( |
) |
|
|
( |
) |
|
|
( |
) |
Net expenses |
|
|
|
|
|
|
|
|
|
|||
Net Investment Income (Loss) |
|
|
|
|
|
|
|
|
|
|||
|
|
|
|
|
|
|
|
|
|
|||
Realized and unrealized gains (losses) on investments and foreign currency |
|
|
|
|
|
|
|
|
|
|||
Net realized gains (losses): |
|
|
|
|
|
|
|
|
|
|||
Non-controlled, non-affiliated investments |
|
|
( |
) |
|
|
( |
) |
|
|
( |
) |
Total net realized gains (losses) |
|
|
( |
) |
|
|
( |
) |
|
|
( |
) |
Net change in unrealized gains (losses): |
|
|
|
|
|
|
|
|
|
|||
Non-controlled, non-affiliated investments |
|
|
|
|
|
|
|
|
( |
) |
||
Total net change in unrealized gains (losses) |
|
|
|
|
|
|
|
|
( |
) |
||
Total realized and unrealized gains (losses) |
|
|
( |
) |
|
|
|
|
|
( |
) |
|
|
|
|
|
|
|
|
|
|
|
|||
Net Increase (Decrease) in Net Assets Resulting from Operations |
|
$ |
|
|
$ |
|
|
$ |
( |
) |
||
|
|
|
|
|
|
|
|
|
|
|||
Per Common Share Data: |
|
|
|
|
|
|
|
|
|
|||
Basic and diluted net investment income per common share |
|
$ |
|
|
$ |
|
|
$ |
|
|||
Basic and diluted net increase (decrease) in net assets resulting from operations |
|
$ |
|
|
$ |
|
|
$ |
( |
) |
||
Weighted Average Common Shares Outstanding - Basic and Diluted |
|
|
|
|
|
|
|
|
|
|||
The accompanying notes are an integral part of these consolidated financial statements.
F-4
Palmer Square Capital BDC Inc.
Consolidated Statements of Changes in Net Assets
|
|
For the Year Ended December 31, |
|
|||||||||
|
|
2024 |
|
|
2023 |
|
|
2022 |
|
|||
Increase (Decrease) in Net Assets Resulting from Operations: |
|
|
|
|
|
|
|
|
|
|||
Net investment income (loss) |
|
$ |
|
|
$ |
|
|
$ |
|
|||
Net realized gains (losses) on investments and foreign currency |
|
|
( |
) |
|
|
( |
) |
|
|
( |
) |
Net change in unrealized gains (losses) on investments, foreign currency |
|
|
|
|
|
|
|
|
( |
) |
||
Net Increase (Decrease) in Net Assets Resulting from Operations |
|
|
|
|
|
|
|
|
( |
) |
||
|
|
|
|
|
|
|
|
|
|
|||
Decrease in Net Assets Resulting from Stockholder Distributions |
|
|
|
|
|
|
|
|
|
|||
Dividends and distributions to stockholders |
|
|
( |
) |
|
|
( |
) |
|
|
( |
) |
Distributions declared from realized gains |
|
|
|
|
|
|
|
|
( |
) |
||
Net Decrease in Net Assets Resulting from Stockholder Distributions |
|
|
( |
) |
|
|
( |
) |
|
|
( |
) |
|
|
|
|
|
|
|
|
|
|
|||
Increase in Net Assets Resulting from Capital Share Transactions |
|
|
|
|
|
|
|
|
|
|||
Issuance of common shares |
|
|
|
|
|
|
|
|
|
|||
Shares issued in connection with dividend reinvestment plan (Note 7) |
|
|
|
|
|
|
|
|
|
|||
Repurchase of common shares |
|
|
( |
) |
|
|
|
|
|
|
||
Net Increase in Net Assets Resulting from Capital Share Transactions |
|
|
|
|
|
|
|
|
|
|||
Total Increase (Decrease) in Net Assets |
|
|
|
|
|
|
|
|
( |
) |
||
Net Assets, Beginning of Period |
|
|
|
|
|
|
|
|
|
|||
Net Assets, End of Period |
|
$ |
|
|
$ |
|
|
$ |
|
|||
The accompanying notes are an integral part of these consolidated financial statements.
F-5
Palmer Square Capital BDC Inc.
Consolidated Statements of Cash Flows
|
|
For the Year Ended December 31, |
|
|||||||||
|
|
2024 |
|
|
2023 |
|
|
2022 |
|
|||
Cash Flows from Operating Activities: |
|
|
|
|
|
|
|
|
|
|||
Net increase (decrease) in net assets resulting from operations |
|
$ |
|
|
$ |
|
|
$ |
( |
) |
||
Adjustments to reconcile net increase (decrease) in net assets resulting from |
|
|
|
|
|
|
|
|
|
|||
Net realized (gains)/losses on investments |
|
|
|
|
|
|
|
|
|
|||
Net change in unrealized (gains)/losses on investments |
|
|
( |
) |
|
|
( |
) |
|
|
|
|
Net accretion of discount on investments |
|
|
( |
) |
|
|
( |
) |
|
|
( |
) |
Payment-in-kind interest |
|
|
( |
) |
|
|
|
|
|
|
||
Purchases of short-term investments |
|
|
( |
) |
|
|
( |
) |
|
|
( |
) |
Purchases of portfolio investments |
|
|
( |
) |
|
|
( |
) |
|
|
( |
) |
Proceeds from sale of short-term investments |
|
|
|
|
|
|
|
|
|
|||
Proceeds from sale of portfolio investments |
|
|
|
|
|
|
|
|
|
|||
Amortization of deferred financing cost |
|
|
|
|
|
|
|
|
|
|||
Increase/(decrease) in operating assets and liabilities: |
|
|
|
|
|
|
|
|
|
|||
(Increase)/decrease in receivable for sales of investments |
|
|
( |
) |
|
|
|
|
|
( |
) |
|
(Increase)/decrease in interest and dividends receivable |
|
|
( |
) |
|
|
( |
) |
|
|
( |
) |
(Increase)/decrease in due from investment adviser |
|
|
|
|
|
( |
) |
|
|
|
||
(Increase)/decrease in receivable for paydowns of investments |
|
|
( |
) |
|
|
( |
) |
|
|
|
|
(Increase)/decrease in prepaid expenses and other assets |
|
|
( |
) |
|
|
|
|
|
( |
) |
|
Increase/(decrease) in interest payable on credit facilities |
|
|
|
|
|
|
|
|
|
|||
Increase/(decrease) in payable for investments purchased |
|
|
|
|
|
( |
) |
|
|
( |
) |
|
Increase/(decrease) in management fees payable |
|
|
|
|
|
|
|
|
( |
) |
||
Increase/(decrease) in incentive fee payable |
|
|
|
|
|
|
|
|
|
|||
Increase/(decrease) in directors fee payable |
|
|
|
|
|
|
|
|
( |
) |
||
Increase/(decrease) in accrued other general and administrative expenses |
|
|
|
|
|
( |
) |
|
|
( |
) |
|
Net cash provided by (used in) operating activities |
|
|
( |
) |
|
|
|
|
|
|
||
|
|
|
|
|
|
|
|
|
|
|||
Cash Flows from Financing Activities: |
|
|
|
|
|
|
|
|
|
|||
Borrowings on the credit facilities |
|
|
|
|
|
|
|
|
|
|||
Payments on the credit facilities |
|
|
( |
) |
|
|
( |
) |
|
|
( |
) |
Borrowings on the notes |
|
|
|
|
|
|
|
|
|
|||
Payments of debt issuance costs |
|
|
( |
) |
|
|
( |
) |
|
|
|
|
Distributions paid in cash |
|
|
( |
) |
|
|
( |
) |
|
|
( |
) |
Proceeds from issuance of common shares, net of change in subscriptions receivable |
|
|
|
|
|
|
|
|
|
|||
Purchase of common shares for dividend reinvestment plan |
|
|
|
|
|
|
|
|
|
|||
Repurchase of common shares |
|
|
( |
) |
|
|
|
|
|
|
||
Net cash provided by (used in) financing activities |
|
|
|
|
|
( |
) |
|
|
( |
) |
|
Net increase/(decrease) in cash and cash equivalents |
|
|
|
|
|
|
|
|
|
|||
Cash and cash equivalents, beginning of period |
|
|
|
|
|
|
|
|
|
|||
Cash and cash equivalents, end of period |
|
$ |
|
|
$ |
|
|
$ |
|
|||
|
|
|
|
|
|
|
|
|
|
|||
Supplemental and Non-Cash Information: |
|
|
|
|
|
|
|
|
|
|||
Interest paid during the period |
|
$ |
|
|
$ |
|
|
$ |
|
|||
Distributions declared during the period |
|
$ |
|
|
$ |
|
|
$ |
|
|||
Reinvestment of distributions during the period |
|
$ |
|
|
$ |
|
|
$ |
|
|||
Distributions payable |
|
$ |
|
|
$ |
|
|
$ |
|
|||
The accompanying notes are an integral part of these consolidated financial statements.
F-6
Palmer Square Capital BDC Inc.
Consolidated Schedules of Investments
As of December 31, 2024
Portfolio Company(3) |
|
Industry |
|
Interest Rate |
|
Maturity |
|
Principal / Par |
|
|
Amortized |
|
|
Fair Value |
|
|
Percentage of |
|
||||
Debt Investments |
|
|
|
|
|
|
|
|
|
|
|
|
|
|
|
|
|
|
||||
First Lien Senior Secured(2) |
|
|
|
|
|
|
|
|
|
|
|
|
|
|
|
|
|
|
||||
888 Holdings PLC (4)(8) |
|
Hotels, Restaurants and Leisure |
|
|
|
$ |
|
|
$ |
|
|
$ |
|
|
|
% |
||||||
AAdvantage Loyalty IP Ltd. (4)(8) |
|
Insurance |
|
|
|
|
|
|
|
|
|
|
|
|
|
% |
||||||
AccentCare, Inc. (8) |
|
Healthcare Providers and Services |
|
|
|
|
|
|
|
|
|
|
|
|
|
% |
||||||
Accession Risk Management Group, Inc. (6) |
|
Insurance |
|
|
|
|
|
|
|
|
|
|
|
|
|
% |
||||||
Accession Risk Management Group, Inc. (6) |
|
Insurance |
|
|
|
|
|
|
|
|
|
|
|
|
|
% |
||||||
Accession Risk Management Group, Inc. (7) |
|
Insurance |
|
|
|
|
|
|
|
|
|
|
|
|
|
% |
||||||
Acrisure, LLC (8) |
|
Insurance |
|
|
|
|
|
|
|
|
|
|
|
|
|
% |
||||||
Ahead DB Holdings, LLC (8) |
|
IT Services |
|
|
|
|
|
|
|
|
|
|
|
|
|
% |
||||||
Aimbridge Acquisition Co., Inc. (8) |
|
Hotels, Restaurants and Leisure |
|
|
|
|
|
|
|
|
|
|
|
|
|
% |
||||||
Albion Financing 3 S.a r.l. (Albion Financing LLC) (4)(8) |
|
Diversified Consumer Services |
|
|
|
|
|
|
|
|
|
|
|
|
|
% |
||||||
Alliance Laundry Systems LLC (8) |
|
Machinery |
|
|
|
|
|
|
|
|
|
|
|
|
|
% |
||||||
Allied Universal Holdco LLC (8) |
|
Professional Services |
|
|
|
|
|
|
|
|
|
|
|
|
|
% |
||||||
American Rock Salt Company LLC (6) |
|
Metals and Mining |
|
|
|
|
|
|
|
|
|
|
|
|
|
% |
||||||
American Rock Salt Company LLC (6)(11) |
|
Metals and Mining |
|
|
|
|
|
|
|
|
|
|
|
|
|
% |
||||||
American Rock Salt Company LLC (6) |
|
Metals and Mining |
|
|
|
|
|
|
|
|
|
|
|
|
|
% |
||||||
Amynta Agency Borrower Inc. (Amynta Warranty Borrower Inc.) (8) |
|
Insurance |
|
|
|
|
|
|
|
|
|
|
|
|
|
% |
||||||
Ankura Consulting Group, LLC (6) |
|
Professional Services |
|
|
|
|
|
|
|
|
|
|
|
|
|
% |
||||||
AP Gaming I, LLC (4)(8) |
|
Hotels, Restaurants and Leisure |
|
|
|
|
|
|
|
|
|
|
|
|
|
% |
||||||
Aptean Acquiror Inc. (7)(12) |
|
Software |
|
|
|
|
|
|
|
|
|
|
|
|
|
% |
||||||
Aptean Acquiror Inc. (7) |
|
Software |
|
|
|
|
|
|
|
|
|
|
|
|
|
% |
||||||
Aramsco, Inc. (7) |
|
Machinery |
|
|
|
|
|
|
|
|
|
|
|
|
|
% |
||||||
ARC Falcon I Inc. (8) |
|
Chemicals |
|
|
|
|
|
|
|
|
|
|
|
|
|
% |
||||||
Aretec Group, Inc. (8) |
|
Diversified Financial Services |
|
|
|
|
|
|
|
|
|
|
|
|
|
% |
||||||
Aruba Investments, Inc. (8) |
|
Chemicals |
|
|
|
|
|
|
|
|
|
|
|
|
|
% |
||||||
Ascend Learning, LLC (8) |
|
Professional Services |
|
|
|
|
|
|
|
|
|
|
|
|
|
% |
||||||
Aspire Bakeries Holdings, LLC (8) |
|
Food Products |
|
|
|
|
|
|
|
|
|
|
|
|
|
% |
||||||
AssuredPartners, Inc (8) |
|
Insurance |
|
|
|
|
|
|
|
|
|
|
|
|
|
% |
||||||
Athletico Management, LLC (6) |
|
Healthcare Providers and Services |
|
|
|
|
|
|
|
|
|
|
|
|
|
% |
||||||
Autokiniton US Holdings, Inc. (8) |
|
Auto Components |
|
|
|
|
|
|
|
|
|
|
|
|
|
% |
||||||
Aveanna Healthcare LLC (4)(8) |
|
Healthcare Providers and Services |
|
|
|
|
|
|
|
|
|
|
|
|
|
% |
||||||
Bach Finance Limited (4)(8) |
|
Diversified Consumer Services |
|
|
|
|
|
|
|
|
|
|
|
|
|
% |
||||||
BarBri Holdings, Inc. (7) |
|
Professional Services |
|
|
|
|
|
|
|
|
|
|
|
|
|
% |
||||||
Barracuda Networks, Inc. (8) |
|
Software |
|
|
|
|
|
|
|
|
|
|
|
|
|
% |
||||||
B'laster Holdings, LLC (7) |
|
Chemicals |
|
|
|
|
|
|
|
|
|
|
|
|
|
% |
||||||
F-7
Palmer Square Capital BDC Inc.
Consolidated Schedules of Investments
As of December 31, 2024
Portfolio Company(3) |
|
Industry |
|
Interest Rate |
|
Maturity Date |
|
Principal / Par |
|
|
Amortized |
|
|
Fair Value |
|
|
Percentage of |
|
||||
B'laster Holdings, LLC (6) |
|
Chemicals |
|
|
|
|
|
|
|
|
|
|
|
|
|
% |
||||||
Boxer Parent Company Inc. (8) |
|
Software |
|
|
|
|
|
|
|
|
|
|
|
|
|
% |
||||||
Carriage Purchaser, Inc. (8) |
|
Road and Rail |
|
|
|
|
|
|
|
|
|
|
|
|
|
% |
||||||
Carroll County Energy LLC (6) |
|
Independent Power and Renewable Electricity Producers |
|
|
|
|
|
|
|
|
|
|
|
|
|
% |
||||||
Castle US Holding Corporation (7) |
|
Professional Services |
|
|
|
|
|
|
|
|
|
|
|
|
|
% |
||||||
Castle US Holding Corporation (6) |
|
Professional Services |
|
|
|
|
|
|
|
|
|
|
|
|
|
% |
||||||
CCI Buyer, Inc. (8) |
|
Wireless Telecommunication Services |
|
|
|
|
|
|
|
|
|
|
|
|
|
% |
||||||
Cengage Learning, Inc. (8) |
|
Diversified Consumer Services |
|
|
|
|
|
|
|
|
|
|
|
|
|
% |
||||||
Century De Buyer LLC (8) |
|
Media |
|
|
|
|
|
|
|
|
|
|
|
|
|
% |
||||||
Congruex Group LLC (7) |
|
Construction and Engineering |
|
|
|
|
|
|
|
|
|
|
|
|
|
% |
||||||
Connectwise LLC (8) |
|
IT Services |
|
|
|
|
|
|
|
|
|
|
|
|
|
% |
||||||
Consolidated Communications, Inc. (4)(8) |
|
Diversified Telecommunication Services |
|
|
|
|
|
|
|
|
|
|
|
|
|
% |
||||||
ConvergeOne Holdings, Inc. (6) |
|
IT Services |
|
|
|
|
|
|
|
|
|
|
|
|
|
% |
||||||
Corelogic, Inc. (8) |
|
Internet Software and Services |
|
|
|
|
|
|
|
|
|
|
|
|
|
% |
||||||
CP Atlas Buyer, Inc (8) |
|
Building Products |
|
|
|
|
|
|
|
|
|
|
|
|
|
% |
||||||
CPM Holdings, Inc. (8) |
|
Machinery |
|
|
|
|
|
|
|
|
|
|
|
|
|
% |
||||||
Creation Technologies Inc. (4)(8) |
|
Electronic Equipment, Instruments and Components |
|
|
|
|
|
|
|
|
|
|
|
|
|
% |
||||||
Crown Subsea Communications Holding, Inc. (8) |
|
Construction and Engineering |
|
|
|
|
|
|
|
|
|
|
|
|
|
% |
||||||
Curia Global, Inc. (8) |
|
Healthcare Providers and Services |
|
|
|
|
|
|
|
|
|
|
|
|
|
% |
||||||
Deerfield Dakota Holding, LLC (8) |
|
Diversified Financial Services |
|
|
|
|
|
|
|
|
|
|
|
|
|
% |
||||||
Delivery Hero SE (4)(6) |
|
Diversified Consumer Services |
|
|
|
|
|
|
|
|
|
|
|
|
|
% |
||||||
Delta Topco, Inc. (6) |
|
IT Services |
|
|
|
|
|
|
|
|
|
|
|
|
|
% |
||||||
DIRECTV Financing, LLC (8) |
|
Media |
|
|
|
|
|
|
|
|
|
|
|
|
|
% |
||||||
Dotdash Meredith, Inc. (4)(8) |
|
Media |
|
|
|
|
|
|
|
|
|
|
|
|
|
% |
||||||
Dwyer Instruments, LLC (6) |
|
Electronic Equipment, Instruments and Components |
|
|
|
|
|
|
|
|
|
|
|
|
|
% |
||||||
ECL Entertainment, LLC (7) |
|
Hotels, Restaurants and Leisure |
|
|
|
|
|
|
|
|
|
|
|
|
|
% |
||||||
Edelman Financial Engines Center, LLC, The (6) |
|
Diversified Financial Services |
|
|
|
|
|
|
|
|
|
|
|
|
|
% |
||||||
Edgewater Generation, L.L.C. (8) |
|
Independent Power and Renewable Electricity Producers |
|
|
|
|
|
|
|
|
|
|
|
|
|
% |
||||||
EFS Cogen Holdings I, LLC (8) |
|
Independent Power and Renewable Electricity Producers |
|
|
|
|
|
|
|
|
|
|
|
|
|
% |
||||||
Endurance International Group, Inc., The (8) |
|
Professional Services |
|
|
|
|
|
|
|
|
|
|
|
|
|
% |
||||||
Enverus Holdings, Inc. (7)(13) |
|
Software |
|
|
|
|
|
|
|
|
|
|
|
|
|
% |
||||||
Enverus Holdings, Inc. (7) |
|
Software |
|
|
|
|
|
|
|
|
|
|
|
|
|
% |
||||||
EP Purchaser, LLC (8) |
|
Professional Services |
|
|
|
|
|
|
|
|
|
|
|
|
|
% |
||||||
EPIC Y-Grade Services, LP (8) |
|
Energy Equipment and Services |
|
|
|
|
|
|
|
|
|
|
|
|
|
% |
||||||
Everest SubBidCo (4)(8) |
|
IT Services |
|
|
|
|
|
|
|
|
|
|
|
|
|
% |
||||||
F-8
Palmer Square Capital BDC Inc.
Consolidated Schedules of Investments
As of December 31, 2024
Portfolio Company(3) |
|
Industry |
|
Interest Rate |
|
Maturity Date |
|
Principal / Par |
|
|
Amortized |
|
|
Fair Value |
|
|
Percentage of |
|
||||
Filtration Group Corporation (8) |
|
Industrial Conglomerates |
|
|
|
|
|
|
|
|
|
|
|
|
|
% |
||||||
First Brands Group, LLC (8) |
|
Auto Components |
|
|
|
|
|
|
|
|
|
|
|
|
|
% |
||||||
Flash Charm, Inc. (8) |
|
IT Services |
|
|
|
|
|
|
|
|
|
|
|
|
|
% |
||||||
Flexera Software LLC (8) |
|
Software |
|
|
|
|
|
|
|
|
|
|
|
|
|
% |
||||||
Forest City Enterprises, L.P. (8) |
|
Real Estate Management and Development |
|
|
|
|
|
|
|
|
|
|
|
|
|
% |
||||||
Fugue Finance, LLC (4)(8) |
|
Diversified Consumer Services |
|
|
|
|
|
|
|
|
|
|
|
|
|
% |
||||||
Gainwell Acquisition Corp. (8) |
|
Healthcare Providers and Services |
|
|
|
|
|
|
|
|
|
|
|
|
|
% |
||||||
Galway Borrower LLC (7)(15) |
|
Insurance |
|
|
|
|
|
|
|
|
|
|
|
|
|
% |
||||||
Galway Borrower LLC (7)(14) |
|
Insurance |
|
|
|
|
|
|
|
|
|
|
|
|
|
% |
||||||
Garda World Security Corporation (4)(8) |
|
Diversified Consumer Services |
|
|
|
|
|
|
|
|
|
|
|
|
|
% |
||||||
Genuine Financial Holdings LLC (8) |
|
Professional Services |
|
|
|
|
|
|
|
|
|
|
|
|
|
% |
||||||
Global Medical Response, Inc. (6) |
|
Healthcare Providers and Services |
|
|
|
|
|
|
|
|
|
|
|
|
|
% |
||||||
Gloves Buyer, Inc. (8) |
|
Industrial Conglomerates |
|
|
|
|
|
|
|
|
|
|
|
|
|
% |
||||||
Great Outdoors Group, LLC (8) |
|
Specialty Retail |
|
|
|
|
|
|
|
|
|
|
|
|
|
% |
||||||
Grinding Media Inc. (Molycop Ltd.) (8) |
|
Metals and Mining |
|
|
|
|
|
|
|
|
|
|
|
|
|
% |
||||||
GS AcquisitionCo, Inc. (7) |
|
Software |
|
|
|
|
|
|
|
|
|
|
|
|
|
% |
||||||
GS AcquisitionCo, Inc. (7)(16) |
|
Software |
|
|
|
|
|
|
|
|
|
|
|
|
|
% |
||||||
HAH Group Holding Company LLC (8) |
|
Healthcare Providers and Services |
|
|
|
|
|
|
|
|
|
|
|
|
|
% |
||||||
Hamilton Projects Acquiror, LLC (6) |
|
Electric Utilities |
|
|
|
|
|
|
|
|
|
|
|
|
|
% |
||||||
Help/Systems Holdings, Inc. (8) |
|
Software |
|
|
|
|
|
|
|
|
|
|
|
|
|
% |
||||||
Holding Socotec (4)(6) |
|
Construction and Engineering |
|
|
|
|
|
|
|
|
|
|
|
|
|
% |
||||||
Hunterstown Generation, LLC (8) |
|
Independent Power and Renewable Electricity Producers |
|
|
|
|
|
|
|
|
|
|
|
|
|
% |
||||||
Idemia Group S.A.S. (4)(8) |
|
Internet Software and Services |
|
|
|
|
|
|
|
|
|
|
|
|
|
% |
||||||
IMA Financial Group, Inc. (7) |
|
Insurance |
|
|
|
|
|
|
|
|
|
|
|
|
|
% |
||||||
Imagefirst Holdings, LLC (7) |
|
Healthcare Providers and Services |
|
|
|
|
|
|
|
|
|
|
|
|
|
% |
||||||
Inception Finco S.a r.l. (4)(7) |
|
Healthcare Providers and Services |
|
|
|
|
|
|
|
|
|
|
|
|
|
% |
||||||
Ineos Quattro Holdings UK Limited (4)(8) |
|
Chemicals |
|
|
|
|
|
|
|
|
|
|
|
|
|
% |
||||||
Ineos Quattro Holdings UK Limited (4)(6) |
|
Chemicals |
|
|
|
|
|
|
|
|
|
|
|
|
|
% |
||||||
Ineos US Finance LLC (4)(8) |
|
Chemicals |
|
|
|
|
|
|
|
|
|
|
|
|
|
% |
||||||
Infinite Bidco, LLC (8) |
|
Electronic Equipment, Instruments and Components |
|
|
|
|
|
|
|
|
|
|
|
|
|
% |
||||||
Infinite Bidco, LLC (6) |
|
Electronic Equipment, Instruments and Components |
|
|
|
|
|
|
|
|
|
|
|
|
|
% |
||||||
Inmar, Inc. (8) |
|
Professional Services |
|
|
|
|
|
|
|
|
|
|
|
|
|
% |
||||||
Invenergy Thermal Operating I LLC (8) |
|
Independent Power and Renewable Electricity Producers |
|
|
|
|
|
|
|
|
|
|
|
|
|
% |
||||||
Invenergy Thermal Operating I LLC (8) |
|
Independent Power and Renewable Electricity Producers |
|
|
|
|
|
|
|
|
|
|
|
|
|
% |
||||||
Ivanti Software, Inc. (8) |
|
Software |
|
|
|
|
|
|
|
|
|
|
|
|
|
% |
||||||
Ivanti Software, Inc. (8) |
|
Software |
|
|
|
|
|
|
|
|
|
|
|
|
|
% |
||||||
IVC Acquisition, Ltd. (4)(8) |
|
Professional Services |
|
|
|
|
|
|
|
|
|
|
|
|
|
% |
||||||
Jack Ohio Finance LLC (7) |
|
Hotels, Restaurants and Leisure |
|
|
|
|
|
|
|
|
|
|
|
|
|
% |
||||||
Kleopatra Finco S.a.r.l (4)(8) |
|
Containers and Packaging |
|
|
|
|
|
|
|
|
|
|
|
|
|
% |
||||||
LBM Acquisition, LLC (8) |
|
Building Products |
|
|
|
|
|
|
|
|
|
|
|
|
|
% |
||||||
F-9
Palmer Square Capital BDC Inc.
Consolidated Schedules of Investments
As of December 31, 2024
Portfolio Company(3) |
|
Industry |
|
Interest Rate |
|
Maturity Date |
|
Principal / Par |
|
|
Amortized |
|
|
Fair Value |
|
|
Percentage of |
|
||||
Lifescan Global Corporation (6) |
|
Healthcare Equipment and Supplies |
|
|
|
|
|
|
|
|
|
|
|
|
|
% |
||||||
Lightstone Holdco LLC (8) |
|
Independent Power and Renewable Electricity Producers |
|
|
|
|
|
|
|
|
|
|
|
|
|
% |
||||||
Lightstone Holdco LLC (8) |
|
Independent Power and Renewable Electricity Producers |
|
|
|
|
|
|
|
|
|
|
|
|
|
% |
||||||
LogMeIn, Inc. (6) |
|
IT Services |
|
|
|
|
|
|
|
|
|
|
|
|
|
% |
||||||
LogMeIn, Inc. (6) |
|
IT Services |
|
|
|
|
|
|
|
|
|
|
|
|
|
% |
||||||
Logrhythm, Inc. (7) |
|
IT Services |
|
|
|
|
|
|
|
|
|
|
|
|
|
% |
||||||
LSF12 Crown US Commercial Bidco, LLC (8) |
|
Construction and Engineering |
|
|
|
|
|
|
|
|
|
|
|
|
|
% |
||||||
Magenta Security Holdings LLC (6) |
|
Software |
|
|
|
|
|
|
|
|
|
|
|
|
|
% |
||||||
Magenta Security Holdings LLC (6) |
|
Software |
|
|
|
|
|
|
|
|
|
|
|
|
|
% |
||||||
Magenta Security Holdings LLC (6) |
|
Software |
|
|
|
|
|
|
|
|
|
|
|
|
|
% |
||||||
Magenta Security Holdings LLC (6) |
|
Software |
|
|
|
|
|
|
|
|
|
|
|
|
|
% |
||||||
Maverick 1, LLC (6) |
|
Software |
|
|
|
|
|
|
|
|
|
|
|
|
|
% |
||||||
Max US Bidco Inc. (6) |
|
Food Products |
|
|
|
|
|
|
|
|
|
|
|
|
|
% |
||||||
Medical Solutions Holdings, Inc. (8) |
|
Healthcare Providers and Services |
|
|
|
|
|
|
|
|
|
|
|
|
|
% |
||||||
Michael Baker International, LLC (8) |
|
Construction and Engineering |
|
|
|
|
|
|
|
|
|
|
|
|
|
% |
||||||
Micro Holding Corp. (8) |
|
IT Services |
|
|
|
|
|
|
|
|
|
|
|
|
|
% |
||||||
Micro Holding Corp. (8) |
|
IT Services |
|
|
|
|
|
|
|
|
|
|
|
|
|
% |
||||||
Minotaur Acquisition, Inc. (6) |
|
Diversified Financial Services |
|
|
|
|
|
|
|
|
|
|
|
|
|
% |
||||||
Minotaur Acquisition, Inc. (7) |
|
Diversified Financial Services |
|
|
|
|
|
|
|
|
|
|
|
|
|
% |
||||||
MLN US HoldCo LLC (6)(9) |
|
Diversified Telecommunication Services |
|
|
|
|
|
|
|
|
|
|
|
|
|
% |
||||||
Momentive Performance Materials Inc. (8) |
|
Chemicals |
|
|
|
|
|
|
|
|
|
|
|
|
|
% |
||||||
MRI Software LLC (7) |
|
Software |
|
|
|
|
|
|
|
|
|
|
|
|
|
% |
||||||
MRI Software LLC (7)(17) |
|
Software |
|
|
|
|
|
|
|
|
|
|
|
|
|
% |
||||||
NAPA Management Services Corporation (8) |
|
Healthcare Providers and Services |
|
|
|
|
|
|
|
|
|
|
|
|
|
% |
||||||
Natgasoline LLC (8) |
|
Chemicals |
|
|
|
|
|
|
|
|
|
|
|
|
|
% |
||||||
National Mentor Holdings, Inc. (8) |
|
Healthcare Providers and Services |
|
|
|
|
|
|
|
|
|
|
|
|
|
% |
||||||
National Mentor Holdings, Inc. (8) |
|
Healthcare Providers and Services |
|
|
|
|
|
|
|
|
|
|
|
|
|
% |
||||||
Nexus Buyer LLC (8) |
|
Diversified Financial Services |
|
|
|
|
|
|
|
|
|
|
|
|
|
% |
||||||
Nielsen Consumer Inc. (8) |
|
Media |
|
|
|
|
|
|
|
|
|
|
|
|
|
% |
||||||
Northstar Group Services, Inc. (8) |
|
Construction and Engineering |
|
|
|
|
|
|
|
|
|
|
|
|
|
% |
||||||
NSM Top Holdings Corp. (8) |
|
Healthcare Equipment and Supplies |
|
|
|
|
|
|
|
|
|
|
|
|
|
% |
||||||
Nvent Electric Public Limited Company (4)(8) |
|
Electrical Equipment |
|
|
|
|
|
|
|
|
|
|
|
|
|
% |
||||||
OneDigital Borrower LLC (6) |
|
Insurance |
|
|
|
|
|
|
|
|
|
|
|
|
|
% |
||||||
Ontario Gaming GTA Limited Partnership (4)(8) |
|
Hotels, Restaurants and Leisure |
|
|
|
|
|
|
|
|
|
|
|
|
|
% |
||||||
Optimizely North America Inc. (7) |
|
Software |
|
|
|
|
|
|
|
|
|
|
|
|
|
% |
||||||
Orchid Merger Sub II, LLC (4)(6) |
|
Software |
|
|
|
|
|
|
|
|
|
|
|
|
|
% |
||||||
F-10
Palmer Square Capital BDC Inc.
Consolidated Schedules of Investments
As of December 31, 2024
Portfolio Company(3) |
|
Industry |
|
Interest Rate |
|
Maturity |
|
Principal / Par |
|
|
Amortized |
|
|
Fair Value |
|
|
Percentage of |
|
||||
Oregon Clean Energy, LLC (6) |
|
Independent Power and Renewable Electricity Producers |
|
|
|
|
|
|
|
|
|
|
|
|
|
% |
||||||
Osmosis Buyer Limited (8) |
|
Food Products |
|
|
|
|
|
|
|
|
|
|
|
|
|
% |
||||||
Outcomes Group Holdings, Inc. (8) |
|
Healthcare Providers and Services |
|
|
|
|
|
|
|
|
|
|
|
|
|
% |
||||||
Padagis, LLC (8) |
|
Pharmaceuticals |
|
|
|
|
|
|
|
|
|
|
|
|
|
% |
||||||
Patriot Growth Insurance Services, LLC (7)(18) |
|
Insurance |
|
|
|
|
|
|
|
|
|
|
|
|
|
% |
||||||
Peraton Corp. (8) |
|
Aerospace and Defense |
|
|
|
|
|
|
|
|
|
|
|
|
|
% |
||||||
Plano Holdco, Inc. (8) |
|
Diversified Financial Services |
|
|
|
|
|
|
|
|
|
|
|
|
|
% |
||||||
Pluto Acquisition I, Inc. (6) |
|
Healthcare Providers and Services |
|
|
|
|
|
|
|
|
|
|
|
|
|
% |
||||||
PMHC II Inc. (8) |
|
Chemicals |
|
|
|
|
|
|
|
|
|
|
|
|
|
% |
||||||
Precisely Software Incorporated (8) |
|
IT Services |
|
|
|
|
|
|
|
|
|
|
|
|
|
% |
||||||
Pretium PKG Holdings, Inc. (6) |
|
Containers and Packaging |
|
|
|
|
|
|
|
|
|
|
|
|
|
% |
||||||
Pretium PKG Holdings, Inc. (6) |
|
Containers and Packaging |
|
|
|
|
|
|
|
|
|
|
|
|
|
% |
||||||
Project Alpha Intermediate Holding, Inc. (8) |
|
Software |
|
|
|
|
|
|
|
|
|
|
|
|
|
% |
||||||
Project Boost Purchaser, LLC (8) |
|
Professional Services |
|
|
|
|
|
|
|
|
|
|
|
|
|
% |
||||||
Prometric Holdings, Inc. (8) |
|
Diversified Consumer Services |
|
|
|
|
|
|
|
|
|
|
|
|
|
% |
||||||
PT Intermediate Holdings III, LLC (6) |
|
Machinery |
|
|
|
|
|
|
|
|
|
|
|
|
|
% |
||||||
Radiology Partners, Inc. (8) |
|
Healthcare Providers and Services |
|
|
|
|
|
|
|
|
|
|
|
|
|
% |
||||||
RC Buyer, Inc. (8) |
|
Auto Components |
|
|
|
|
|
|
|
|
|
|
|
|
|
% |
||||||
RealPage, Inc. (6) |
|
Real Estate Management and Development |
|
|
|
|
|
|
|
|
|
|
|
|
|
% |
||||||
RealTruck Group, Inc. (6) |
|
Auto Components |
|
|
|
|
|
|
|
|
|
|
|
|
|
% |
||||||
RealTruck Group, Inc. (6) |
|
Auto Components |
|
|
|
|
|
|
|
|
|
|
|
|
|
% |
||||||
Red Planet Borrower, LLC (6) |
|
Software |
|
|
|
|
|
|
|
|
|
|
|
|
|
% |
||||||
Red Planet Borrower, LLC (8) |
|
Internet Software and Services |
|
|
|
|
|
|
|
|
|
|
|
|
|
% |
||||||
Redstone Holdco 2 LP (6) |
|
IT Services |
|
|
|
|
|
|
|
|
|
|
|
|
|
% |
||||||
Renaissance Holding Corp. (8) |
|
Software |
|
|
|
|
|
|
|
|
|
|
|
|
|
% |
||||||
Rocket Software, Inc. (8) |
|
Software |
|
|
|
|
|
|
|
|
|
|
|
|
|
% |
||||||
Rohm Holding GmbH (4)(6) |
|
Chemicals |
|
|
|
|
|
|
|
|
|
|
|
|
|
% |
||||||
Rohm Holding GmbH (4)(8) |
|
Chemicals |
|
|
|
|
|
|
|
|
|
|
|
|
|
% |
||||||
Runner Buyer Inc. (7) |
|
Household Durables |
|
|
|
|
|
|
|
|
|
|
|
|
|
% |
||||||
F-11
Palmer Square Capital BDC Inc.
Consolidated Schedules of Investments
As of December 31, 2024
Portfolio Company(3) |
|
Industry |
|
Interest Rate |
|
Maturity Date |
|
Principal / Par |
|
|
Amortized |
|
|
Fair Value |
|
|
Percentage of |
|
||||
Ryan, LLC (7) |
|
Professional Services |
|
|
|
|
|
|
|
|
|
|
|
|
|
% |
||||||
Sitel Group (4)(6) |
|
IT Services |
|
|
|
|
|
|
|
|
|
|
|
|
|
% |
||||||
Sovos Compliance, LLC (7) |
|
Software |
|
|
|
|
|
|
|
|
|
|
|
|
|
% |
||||||
Specialty Building Products Holdings, LLC (8) |
|
Building Products |
|
|
|
|
|
|
|
|
|
|
|
|
|
% |
||||||
Star Holding LLC (8) |
|
Energy Equipment and Services |
|
|
|
|
|
|
|
|
|
|
|
|
|
% |
||||||
Stepstone Group MidCo 2 GmbH, The (4)(8) |
|
Interactive Media Services |
|
|
|
|
|
|
|
|
|
|
|
|
|
% |
||||||
Summer BC Holdco B LLC (4)(8) |
|
Media |
|
|
|
|
|
|
|
|
|
|
|
|
|
% |
||||||
Tank Holding Corp. (6)(19) |
|
Containers and Packaging |
|
|
|
|
|
|
|
|
|
|
|
|
|
% |
||||||
Tank Holding Corp. (6) |
|
Containers and Packaging |
|
|
|
|
|
|
|
|
|
|
|
|
|
% |
||||||
Tank Holding Corp. (6) |
|
Containers and Packaging |
|
|
|
|
|
|
|
|
|
|
|
|
|
% |
||||||
TCP Sunbelt Acquisition Co. (8) |
|
Electronic Equipment, Instruments and Components |
|
|
|
|
|
|
|
|
|
|
|
|
|
% |
||||||
Tecta America Corp. (8) |
|
Construction and Engineering |
|
|
|
|
|
|
|
|
|
|
|
|
|
% |
||||||
Thryv, Inc. (4)(6) |
|
Professional Services |
|
|
|
|
|
|
|
|
|
|
|
|
|
% |
||||||
Titan US Finco, LLC (4) |
|
Media |
|
|
|
|
|
|
|
|
|
|
|
|
|
% |
||||||
TMC Buyer, Inc. (6) |
|
Construction and Engineering |
|
|
|
|
|
|
|
|
|
|
|
|
|
% |
||||||
Tosca Services, LLC (8) |
|
Containers and Packaging |
|
|
|
|
|
|
|
|
|
|
|
|
|
% |
||||||
Tosca Services, LLC (6) |
|
Containers and Packaging |
|
|
|
|
|
|
|
|
|
|
|
|
|
% |
||||||
Transnetwork LLC |
|
Diversified Financial Services |
|
|
|
|
|
|
|
|
|
|
|
|
|
% |
||||||
U.S. Renal Care, Inc. (8) |
|
Healthcare Providers and Services |
|
|
|
|
|
|
|
|
|
|
|
|
|
% |
||||||
US Fertility Enterprises, LLC (8) |
|
Healthcare Providers and Services |
|
|
|
|
|
|
|
|
|
|
|
|
|
% |
||||||
US Radiology Specialists, Inc. (8) |
|
Healthcare Providers and Services |
|
|
|
|
|
|
|
|
|
|
|
|
|
% |
||||||
USIC Holdings, Inc. (7)(20) |
|
Construction and Engineering |
|
|
|
|
|
|
|
|
|
|
|
|
|
% |
||||||
USIC Holdings, Inc. (7)(21) |
|
Construction and Engineering |
|
|
|
|
|
|
|
|
|
|
|
|
|
% |
||||||
USIC Holdings, Inc. (7) |
|
Construction and Engineering |
|
|
|
|
|
|
|
|
|
|
|
|
|
% |
||||||
Veracode (8) |
|
Software |
|
|
|
|
|
|
|
|
|
|
|
|
|
% |
||||||
VeriFone Systems, Inc. (6) |
|
Commercial Services and Supplies |
|
|
|
|
|
|
|
|
|
|
|
|
|
% |
||||||
Vocus Group (4)(8) |
|
Diversified Telecommunication Services |
|
|
|
|
|
|
|
|
|
|
|
|
|
% |
||||||
WarHorse Gaming, LLC (6) |
|
Hotels, Restaurants and Leisure |
|
|
|
|
|
|
|
|
|
|
|
|
|
% |
||||||
Waterbridge NDB Operating LLC (8) |
|
Energy Equipment and Services |
|
|
|
|
|
|
|
|
|
|
|
|
|
% |
||||||
Watlow Electric Manufacturing Company (8) |
|
Electrical Equipment |
|
|
|
|
|
|
|
|
|
|
|
|
|
% |
||||||
Wellpath (CCS-CMGC Holdings, Inc.) (6)(9) |
|
Healthcare Providers and Services |
|
|
|
|
|
|
|
|
|
|
|
|
|
% |
||||||
Wellpath Holdings, Inc. (6) |
|
Healthcare Providers and Services |
|
|
|
|
|
|
|
|
|
|
|
|
|
% |
||||||
Wellpath Holdings, Inc. (6) |
|
Healthcare Providers and Services |
|
|
|
|
|
|
|
|
|
|
|
|
|
% |
||||||
Wellpath Holdings, Inc. (6) |
|
Healthcare Providers and Services |
|
|
|
|
|
|
|
|
|
|
|
|
|
% |
||||||
Wellpath Holdings, Inc. (6) |
|
Healthcare Providers and Services |
|
|
|
|
|
|
|
|
|
|
|
|
|
% |
||||||
Wellpath Holdings, Inc. (6) |
|
Healthcare Providers and Services |
|
|
|
|
|
|
|
|
|
|
|
|
|
% |
||||||
Xplor T1, LLC (7) |
|
Professional Services |
|
|
|
|
|
|
|
|
|
|
|
|
|
% |
||||||
Zayo Group Holdings, Inc. (8) |
|
Diversified Telecommunication Services |
|
|
|
|
|
|
|
|
|
|
|
|
|
% |
||||||
Zayo Group Holdings, Inc. (6) |
|
Diversified Telecommunication Services |
|
|
|
|
|
|
|
|
|
|
|
|
|
% |
||||||
Zegona Holdco Limited (4)(8) |
|
Diversified Telecommunication Services |
|
|
|
|
|
|
|
|
|
|
|
|
|
% |
||||||
Total First Lien Senior Secured |
|
|
|
|
|
|
|
|
|
|
|
|
|
|
|
|
|
% |
||||
F-12
Palmer Square Capital BDC Inc.
Consolidated Schedules of Investments
As of December 31, 2024
Portfolio Company(3) |
|
Industry |
|
Interest Rate |
|
Maturity |
|
Principal / Par |
|
|
Amortized Cost(1)(5) |
|
|
Fair Value |
|
|
Percentage of Net Assets |
|
||||
Second Lien Senior Secured(2) |
|
|
|
|
|
|
|
|
|
|
|
|
|
|
|
|
|
|
||||
American Rock Salt Company LLC (6) |
|
Metals and Mining |
|
|
|
|
|
|
|
|
|
|
|
|
|
% |
||||||
ARC Falcon I Inc. (8) |
|
Chemicals |
|
|
|
|
|
|
|
|
|
|
|
|
|
% |
||||||
Aruba Investments, Inc. (8) |
|
Chemicals |
|
|
|
|
|
|
|
|
|
|
|
|
|
% |
||||||
Asurion, LLC (8) |
|
Insurance |
|
|
|
|
|
|
|
|
|
|
|
|
|
% |
||||||
Barracuda Networks, Inc. (6) |
|
Software |
|
|
|
|
|
|
|
|
|
|
|
|
|
% |
||||||
DCert Buyer, Inc. (8) |
|
IT Services |
|
|
|
|
|
|
|
|
|
|
|
|
|
% |
||||||
Delta Topco, Inc. (6) |
|
IT Services |
|
|
|
|
|
|
|
|
|
|
|
|
|
% |
||||||
Edelman Financial Engines Center, LLC, The (8) |
|
Diversified Financial Services |
|
|
|
|
|
|
|
|
|
|
|
|
|
% |
||||||
Ellucian Holdings Inc. (6) |
|
Software |
|
|
|
|
|
|
|
|
|
|
|
|
|
% |
||||||
First Brands Group, LLC (6) |
|
Auto Components |
|
|
|
|
|
|
|
|
|
|
|
|
|
% |
||||||
Flash Charm, Inc. (6) |
|
IT Services |
|
|
|
|
|
|
|
|
|
|
|
|
|
% |
||||||
Gainwell Acquisition Corp. (6) |
|
Healthcare Providers and Services |
|
|
|
|
|
|
|
|
|
|
|
|
|
% |
||||||
Gainwell Acquisition Corp. (6) |
|
Healthcare Providers and Services |
|
|
|
|
|
|
|
|
|
|
|
|
|
% |
||||||
Help/Systems Holdings, Inc. (6) |
|
Software |
|
|
|
|
|
|
|
|
|
|
|
|
|
% |
||||||
Infinite Bidco, LLC (8) |
|
Electronic Equipment, Instruments and Components |
|
|
|
|
|
|
|
|
|
|
|
|
|
% |
||||||
Ivanti Software, Inc. (6) |
|
Software |
|
|
|
|
|
|
|
|
|
|
|
|
|
% |
||||||
Mitchell International, Inc. (8) |
|
Software |
|
|
|
|
|
|
|
|
|
|
|
|
|
% |
||||||
Nexus Buyer LLC (6) |
|
Diversified Financial Services |
|
|
|
|
|
|
|
|
|
|
|
|
|
% |
||||||
OneDigital Borrower LLC (8) |
|
Insurance |
|
|
|
|
|
|
|
|
|
|
|
|
|
% |
||||||
Peraton Corp. (6) |
|
Aerospace and Defense |
|
|
|
|
|
|
|
|
|
|
|
|
|
% |
||||||
Pretium PKG Holdings, Inc. (6) |
|
Containers and Packaging |
|
|
|
|
|
|
|
|
|
|
|
|
|
% |
||||||
Project Boost Purchaser, LLC (8) |
|
Professional Services |
|
|
|
|
|
|
|
|
|
|
|
|
|
% |
||||||
Vision Solutions, Inc. (8) |
|
IT Services |
|
|
|
|
|
|
|
|
|
|
|
|
|
% |
||||||
Total Second Lien Senior Secured |
|
|
|
|
|
|
|
|
|
|
|
|
|
|
|
|
|
% |
||||
|
|
|
|
|
|
|
|
|
|
|
|
|
|
|
|
|
|
|
||||
Corporate Bonds |
|
|
|
|
|
|
|
|
|
|
|
|
|
|
|
|
|
|
||||
Altice Financing S.A. (4)(6) |
|
Diversified Telecommunication Services |
|
|
|
|
|
|
|
|
|
|
|
|
|
% |
||||||
KOBE US Midco 2 Inc (6) |
|
Chemicals |
|
|
|
|
|
|
|
|
|
|
|
|
|
% |
||||||
Total Corporate Bonds |
|
|
|
|
|
|
|
|
|
|
|
|
|
|
|
|
|
% |
||||
|
|
|
|
|
|
|
|
|
|
|
|
|
|
|
|
|
|
|
||||
Total Debt Investments |
|
|
|
|
|
|
|
$ |
|
|
$ |
|
|
$ |
|
|
|
% |
||||
F-13
Palmer Square Capital BDC Inc.
Consolidated Schedules of Investments
As of December 31, 2024
Portfolio Company(3) |
|
Industry |
|
Interest Rate |
|
Maturity Date |
|
Principal / Par |
|
|
Amortized Cost(1)(5) |
|
|
Fair Value |
|
|
Percentage of Net Assets |
|
||||
CLO Mezzanine(2) |
|
|
|
|
|
|
|
|
|
|
|
|
|
|
|
|
|
|
||||
522 Funding CLO 2020-6, Ltd. (4)(6) |
|
Structured Note |
|
|
|
|
|
|
|
|
|
|
|
|
|
% |
||||||
APID 2013-12A ER (4)(6) |
|
Structured Note |
|
|
|
|
|
|
|
|
|
|
|
|
|
% |
||||||
APID 2016-24A (4)(6) |
|
Structured Note |
|
|
|
|
|
|
|
|
|
|
|
|
|
% |
||||||
BABSN 2022-2A ER (4)(6) |
|
Structured Note |
|
|
|
|
|
|
|
|
|
|
|
|
|
% |
||||||
Carlyle US CLO 2020-2, Ltd (4)(6) |
|
Structured Note |
|
|
|
|
|
|
|
|
|
|
|
|
|
% |
||||||
CBAM 2018-8A E1R (4)(6) |
|
Structured Note |
|
|
|
|
|
|
|
|
|
|
|
|
|
% |
||||||
CIFC 2018-4A (4)(6) |
|
Structured Note |
|
|
|
|
|
|
|
|
|
|
|
|
|
% |
||||||
CIFC 2023-2A (4)(6) |
|
Structured Note |
|
|
|
|
|
|
|
|
|
|
|
|
|
% |
||||||
ELM20 2022-7A ER (4)(6) |
|
Structured Note |
|
|
|
|
|
|
|
|
|
|
|
|
|
% |
||||||
ELMW8 2021-1X ER (4)(6) |
|
Structured Note |
|
|
|
|
|
|
|
|
|
|
|
|
|
% |
||||||
GLM 2021-9A FR (4)(6) |
|
Structured Note |
|
|
|
|
|
|
|
|
|
|
|
|
|
% |
||||||
GoldenTree Loan Management US 2020-7A (4)(6) |
|
Structured Note |
|
|
|
|
|
|
|
|
|
|
|
|
|
% |
||||||
GOST 2024-1A E (4)(6) |
|
Structured Note |
|
|
|
|
|
|
|
|
|
|
|
|
|
% |
||||||
HLM 2023-18A (4)(6) |
|
Structured Note |
|
|
|
|
|
|
|
|
|
|
|
|
|
% |
||||||
Thayer Park CLO, Ltd. (4)(6) |
|
Structured Note |
|
|
|
|
|
|
|
|
|
|
|
|
|
% |
||||||
Total CLO Mezzanine |
|
|
|
|
|
|
|
|
|
|
|
|
|
|
|
|
|
% |
||||
|
|
|
|
|
|
|
|
|
|
|
|
|
|
|
|
|
|
|
||||
CLO Equity |
|
|
|
|
|
|
|
|
|
|
|
|
|
|
|
|
|
|
||||
Babson CLO 2018-4A, Ltd. (4)(6) |
|
Structured Subordinated Note |
|
NA |
|
|
|
|
|
|
|
|
|
|
|
|
% |
|||||
Dryden 86 CLO, Ltd. (4)(6) |
|
Structured Subordinated Note |
|
NA |
|
|
|
|
|
|
|
|
|
|
|
|
% |
|||||
HPS Loan Management 12-2018, Ltd. (4)(6) |
|
Structured Subordinated Note |
|
NA |
|
|
|
|
|
|
|
|
|
|
|
|
% |
|||||
Long Point Park CLO, Ltd. (4)(6) |
|
Structured Subordinated Note |
|
NA |
|
|
|
|
|
|
|
|
|
|
|
|
% |
|||||
Regatta XII Funding Ltd. (4)(6) |
|
Structured Subordinated Note |
|
NA |
|
|
|
|
|
|
|
|
|
|
|
|
% |
|||||
Signal Peak CLO, LLC (4)(6) |
|
Structured Subordinated Note |
|
NA |
|
|
|
|
|
|
|
|
|
|
|
|
% |
|||||
Stratus CLO Series 2021-1A (4)(6) |
|
Structured Subordinated Note |
|
NA |
|
|
|
|
|
|
- |
|
|
|
|
|
|
% |
||||
Total CLO Equity |
|
|
|
|
|
|
|
|
|
|
|
|
|
|
|
|
|
% |
||||
F-14
Palmer Square Capital BDC Inc.
Consolidated Schedules of Investments
As of December 31, 2024
|
|
|
|
|
|
|
|
Number of Shares |
|
|
Cost |
|
|
Fair Value |
|
|
Percentage of Net Assets |
|
||||
Equity Investments |
|
|
|
|
|
|
|
|
|
|
|
|
|
|
|
|
|
|
||||
PVKG Investments Holdings Inc (4)(6) |
|
IT Services |
|
|
|
|
|
|
|
|
|
|
|
|
|
|
|
% |
||||
Total Equity Investments |
|
|
|
|
|
|
|
|
|
|
|
|
|
|
|
|
|
% |
||||
|
|
|
|
|
|
|
|
|
|
|
|
|
|
|
|
|
|
|
||||
Total Equity and Other Investments |
|
|
|
|
|
|
|
|
|
|
$ |
|
|
$ |
|
|
|
% |
||||
F-15
Palmer Square Capital BDC Inc.
Consolidated Schedules of Investments
As of December 31, 2024
|
|
|
|
|
|
|
|
Number of Shares |
|
|
Cost |
|
|
Fair Value |
|
|
Percentage of |
|
||||
Short-Term Investments |
|
|
|
|
|
|
|
|
|
|
|
|
|
|
|
|
|
|
||||
Fidelity Investments Money Market Government Portfolio - Institutional Class, |
|
|
|
|
|
|
|
|
|
|
|
|
|
|
|
|
|
% |
||||
Morgan Stanley Liquidity Funds US Dollar Treasury Liquidity Fund - Institutional Class, |
|
|
|
|
|
|
|
|
|
|
|
|
|
|
|
|
|
% |
||||
Total Short-Term Investments |
|
|
|
|
|
|
|
|
|
|
|
|
|
|
|
|
|
% |
||||
Total Investments |
|
|
|
|
|
|
|
|
|
|
$ |
|
|
$ |
|
|
|
% |
||||
Liabilities in Excess of Other Assets |
|
|
|
|
|
|
|
|
|
|
|
|
|
|
( |
) |
|
|
( |
)% |
||
Net Assets |
|
|
|
|
|
|
|
|
|
|
|
|
|
$ |
|
|
|
% |
||||
F-16
The accompanying notes are an integral part of these consolidated financial statements.
F-17
Palmer Square Capital BDC Inc.
Consolidated Schedules of Investments
As of December 31, 2023
Portfolio Company(3) |
|
Industry |
|
Interest Rate |
|
Maturity |
|
Principal / Par |
|
|
Amortized |
|
|
Fair Value |
|
|
Percentage of |
|
||||
Debt Investments |
|
|
|
|
|
|
|
|
|
|
|
|
|
|
|
|
|
|
||||
First Lien Senior Secured(2) |
|
|
|
|
|
|
|
|
|
|
|
|
|
|
|
|
|
|
||||
888 Holdings PLC (4)(6) |
|
Hotels, Restaurants and Leisure |
|
|
|
$ |
|
|
$ |
|
|
$ |
|
|
|
% |
||||||
AAdvantage Loyalty IP Ltd. (4)(6) |
|
Insurance |
|
|
|
|
|
|
|
|
|
|
|
|
|
% |
||||||
AccentCare, Inc. (6) |
|
Healthcare Providers and Services |
|
|
|
|
|
|
|
|
|
|
|
|
|
% |
||||||
Accession Risk Management Group, Inc. (9) |
|
Insurance |
|
|
|
|
|
|
|
|
|
|
|
|
|
% |
||||||
Accession Risk Management Group, Inc. |
|
Insurance |
|
|
|
|
|
|
|
|
|
|
|
|
|
% |
||||||
Accession Risk Management Group, Inc. |
|
Insurance |
|
|
|
|
|
|
|
|
|
|
|
|
|
% |
||||||
Accession Risk Management Group, Inc. (7) |
|
Insurance |
|
|
|
|
|
|
|
|
|
|
|
|
|
% |
||||||
Acrisure, LLC (6) |
|
Insurance |
|
|
|
|
|
|
|
|
|
|
|
|
|
% |
||||||
Acrisure, LLC (6) |
|
Insurance |
|
|
|
|
|
|
|
|
|
|
|
|
|
% |
||||||
AI Aqua Merger Sub, Inc., (6)(7) |
|
Food Products |
|
|
|
|
|
|
|
|
|
|
|
|
|
% |
||||||
Aimbridge Acquisition Co., Inc. (6) |
|
Hotels, Restaurants and Leisure |
|
|
|
|
|
|
|
|
|
|
|
|
|
% |
||||||
Alliant Holdings Intermediate LLC (6) |
|
Insurance |
|
|
|
|
|
|
|
|
|
|
|
|
|
% |
||||||
Allied Universal Holdco LLC (6) |
|
Professional Services |
|
|
|
|
|
|
|
|
|
|
|
|
|
% |
||||||
Amentum Government Services Holdings LLC (6) |
|
Aerospace and Defense |
|
|
|
|
|
|
|
|
|
|
|
|
|
% |
||||||
American Rock Salt Company LLC (6) |
|
Metals and Mining |
|
|
|
|
|
|
|
|
|
|
|
|
|
% |
||||||
Amynta Agency Borrower, Inc. (6) |
|
Insurance |
|
|
|
|
|
|
|
|
|
|
|
|
|
% |
||||||
AP Gaming I, LLC (4)(6) |
|
Hotels, Restaurants and Leisure |
|
|
|
|
|
|
|
|
|
|
|
|
|
% |
||||||
Apollo Finco BV (4) |
|
Household Durables |
|
|
|
|
|
|
|
|
|
|
|
|
|
% |
||||||
Aptean Inc (6)(7) |
|
Software |
|
|
|
|
|
|
|
|
|
|
|
|
|
% |
||||||
Aptean Inc (7) |
|
Software |
|
|
|
|
|
|
|
|
|
|
|
|
|
% |
||||||
AQA Acquisition Holding, Inc. (6) |
|
Software |
|
|
|
|
|
|
|
|
|
|
|
|
|
% |
||||||
Aramsco, Inc. (7) |
|
Machinery |
|
|
|
|
|
|
|
|
|
|
|
|
|
% |
||||||
ARC Falcon I Inc. (6) |
|
Chemicals |
|
|
|
|
|
|
|
|
|
|
|
|
|
% |
||||||
Aretec Group, Inc. (6) |
|
Diversified Financial Services |
|
|
|
|
|
|
|
|
|
|
|
|
|
% |
||||||
F-18
Palmer Square Capital BDC Inc.
Consolidated Schedules of Investments
As of December 31, 2023
Portfolio Company(3) |
|
Industry |
|
Interest Rate |
|
Maturity Date |
|
Principal / Par |
|
|
Amortized Cost(1)(5) |
|
|
Fair Value |
|
|
Percentage of Net Assets |
|
||||
Ascend Learning, LLC (6) |
|
Professional Services |
|
|
|
|
|
|
|
|
|
|
|
|
|
% |
||||||
Aspire Bakeries Holdings, LLC (6) |
|
Food Products |
|
|
|
|
|
|
|
|
|
|
|
|
|
% |
||||||
AssuredPartners, Inc. (6) |
|
Insurance |
|
|
|
|
|
|
|
|
|
|
|
|
|
% |
||||||
AssuredPartners, Inc. (6) |
|
Insurance |
|
|
|
|
|
|
|
|
|
|
|
|
|
% |
||||||
Athletico Management, LLC (6) |
|
Healthcare Providers and Services |
|
|
|
|
|
|
|
|
|
|
|
|
|
% |
||||||
Autokiniton US Holdings, Inc. (6)(7) |
|
Auto Components |
|
|
|
|
|
|
|
|
|
|
|
|
|
% |
||||||
Aveanna Healthcare LLC (4)(6) |
|
Healthcare Providers and Services |
|
|
|
|
|
|
|
|
|
|
|
|
|
% |
||||||
Barracuda Networks, Inc. (6) |
|
Software |
|
|
|
|
|
|
|
|
|
|
|
|
|
% |
||||||
B'laster Holdings, LLC (7) |
|
Chemicals |
|
|
|
|
|
|
|
|
|
|
|
|
|
% |
||||||
Boxer Parent Company, Inc. (6) |
|
Software |
|
|
|
|
|
|
|
|
|
|
|
|
|
% |
||||||
Castle US Holding Corporation (7) |
|
Professional Services |
|
|
|
|
|
|
|
|
|
|
|
|
|
% |
||||||
Castle US Holding Corporation (6)(7) |
|
Professional Services |
|
|
|
|
|
|
|
|
|
|
|
|
|
% |
||||||
CCI Buyer, Inc. (6)(7) |
|
Wireless Telecommunication Services |
|
|
|
|
|
|
|
|
|
|
|
|
|
% |
||||||
CCS-CMGC Holdings, Inc. (6) |
|
Healthcare Providers and Services |
|
|
|
|
|
|
|
|
|
|
|
|
|
% |
||||||
CDK Global (6) |
|
Software |
|
|
|
|
|
|
|
|
|
|
|
|
|
% |
||||||
Congruex Group LLC (7) |
|
Construction and Engineering |
|
|
|
|
|
|
|
|
|
|
|
|
|
% |
||||||
Connectwise LLC (6) |
|
IT Services |
|
|
|
|
|
|
|
|
|
|
|
|
|
% |
||||||
Consolidated Communications, Inc. (4)(6) |
|
Diversified Telecommunication Services |
|
|
|
|
|
|
|
|
|
|
|
|
|
% |
||||||
ConvergeOne Holdings Corp. (6)(7)(2) |
|
IT Services |
|
|
|
|
|
|
|
|
|
|
|
|
|
% |
||||||
Corelogic, Inc. (6) |
|
Internet Software and Services |
|
|
|
|
|
|
|
|
|
|
|
|
|
% |
||||||
CP Atlas Buyer, Inc (6) |
|
Building Products |
|
|
|
|
|
|
|
|
|
|
|
|
|
% |
||||||
CPM Holdings, Inc. (6) |
|
Machinery |
|
|
|
|
|
|
|
|
|
|
|
|
|
% |
||||||
Creation Technologies, Inc. (4)(7) |
|
Electronic Equipment, Instruments and Components |
|
|
|
|
|
|
|
|
|
|
|
|
|
% |
||||||
Crown Subsea Communications Holding, Inc. (6) |
|
Construction and Engineering |
|
|
|
|
|
|
|
|
|
|
|
|
|
% |
||||||
F-19
Palmer Square Capital BDC Inc.
Consolidated Schedules of Investments
As of December 31, 2023
Portfolio Company(3) |
|
Industry |
|
Interest Rate |
|
Maturity |
|
Principal / Par |
|
|
Amortized |
|
|
Fair Value |
|
|
Percentage of |
|
||||
Curia Global, Inc. (6) |
|
Healthcare Providers and Services |
|
|
|
|
|
|
|
|
|
|
|
|
|
% |
||||||
Deerfield Dakota Holding, LLC (6) |
|
Diversified Financial Services |
|
|
|
|
|
|
|
|
|
|
|
|
|
% |
||||||
Delta Topco, Inc. (6) |
|
IT Services |
|
|
|
|
|
|
|
|
|
|
|
|
|
% |
||||||
DIRECTV Financing, LLC (6) |
|
Media |
|
|
|
|
|
|
|
|
|
|
|
|
|
% |
||||||
Dotdash Meredith, Inc. (6) |
|
Media |
|
|
|
|
|
|
|
|
|
|
|
|
|
% |
||||||
EAB Global, Inc. (6) |
|
Professional Services |
|
|
|
|
|
|
|
|
|
|
|
|
|
% |
||||||
ECI Software Solutions, Inc. (6) |
|
Software |
|
|
|
|
|
|
|
|
|
|
|
|
|
% |
||||||
ECL Entertainment, LLC (7) |
|
Hotels, Restaurants and Leisure |
|
|
|
|
|
|
|
|
|
|
|
|
|
% |
||||||
EFS Cogen Holdings I, LLC (6)(7) |
|
Independent Power and Renewable Electricity Producers |
|
|
|
|
|
|
|
|
|
|
|
|
|
% |
||||||
Endurance International Group, Inc., The (6) |
|
Professional Services |
|
|
|
|
|
|
|
|
|
|
|
|
|
% |
||||||
EnergySolutions, LLC (6) |
|
Commercial Services and Supplies |
|
|
|
|
|
|
|
|
|
|
|
|
|
% |
||||||
Enverus Holdings, Inc. (7) |
|
Software |
|
|
|
|
|
|
|
|
|
|
|
|
|
% |
||||||
EP Purchaser, LLC (6) |
|
Professional Services |
|
|
|
|
|
|
|
|
|
|
|
|
|
% |
||||||
EPIC Y-Grade Services, LP (6) |
|
Energy Equipment and Services |
|
|
|
|
|
|
|
|
|
|
|
|
|
% |
||||||
Fertitta Entertainment, LLC (6) |
|
Hotels, Restaurants and Leisure |
|
|
|
|
|
|
|
|
|
|
|
|
|
% |
||||||
Filtration Group Corp. (6) |
|
Industrial Conglomerates |
|
|
|
|
|
|
|
|
|
|
|
|
|
% |
||||||
Flexera Software LLC (6)(7) |
|
Software |
|
|
|
|
|
|
|
|
|
|
|
|
|
% |
||||||
Fugue Finance, LLC (4)(6) |
|
Diversified Consumer Services |
|
|
|
|
|
|
|
|
|
|
|
|
|
% |
||||||
Gainwell Acquisition Corp. (6) |
|
Healthcare Providers and Services |
|
|
|
|
|
|
|
|
|
|
|
|
|
% |
||||||
Garda World Security Corporation (4)(6) |
|
Diversified Consumer Services |
|
|
|
|
|
|
|
|
|
|
|
|
|
% |
||||||
Generation Bridge Northeast, LLC (6) |
|
Independent Power and Renewable Electricity Producers |
|
|
|
|
|
|
|
|
|
|
|
|
|
% |
||||||
Genuine Financial Holdings LLC (4)(6) |
|
Professional Services |
|
|
|
|
|
|
|
|
|
|
|
|
|
% |
||||||
F-20
Palmer Square Capital BDC Inc.
Consolidated Schedules of Investments
As of December 31, 2023
Portfolio Company(3) |
|
Industry |
|
Interest Rate |
|
Maturity Date |
|
Principal / Par |
|
|
Amortized Cost(1)(5) |
|
|
Fair Value |
|
|
Percentage of Net Assets |
|
||||
Getty Images, Inc. (4)(6)(7) |
|
Media |
|
|
|
|
|
|
|
|
|
|
|
|
|
% |
||||||
Global Medical Response, Inc. (6) |
|
Healthcare Providers and Services |
|
|
|
|
|
|
|
|
|
|
|
|
|
% |
||||||
Gloves Buyer, Inc. |
|
Machinery |
|
|
|
|
|
|
|
|
|
|
|
|
|
% |
||||||
Grab Holdings Inc (4)(6) |
|
IT Services |
|
|
|
|
|
|
|
|
|
|
|
|
|
% |
||||||
Great Outdoors Group, LLC (6) |
|
Specialty Retail |
|
|
|
|
|
|
|
|
|
|
|
|
|
% |
||||||
Grinding Media Inc. (7) |
|
Metals and Mining |
|
|
|
|
|
|
|
|
|
|
|
|
|
% |
||||||
HAH Group Holding Company LLC (6) |
|
Healthcare Providers and Services |
|
|
|
|
|
|
|
|
|
|
|
|
|
% |
||||||
HAH Group Holding Company LLC (6) |
|
Healthcare Providers and Services |
|
|
|
|
|
|
|
|
|
|
|
|
|
% |
||||||
Hamilton Projects Acquiror, LLC (6)(7) |
|
Independent Power and Renewable Electricity Producers |
|
|
|
|
|
|
|
|
|
|
|
|
|
% |
||||||
Helios Software Holdings, Inc. (4)(6) |
|
Diversified Financial Services |
|
|
|
|
|
|
|
|
|
|
|
|
|
% |
||||||
Help/Systems Holdings, Inc. (6) |
|
Software |
|
|
|
|
|
|
|
|
|
|
|
|
|
% |
||||||
HUB International Ltd. |
|
Insurance |
|
|
|
|
|
|
|
|
|
|
|
|
|
% |
||||||
Idera, Inc. (6) |
|
IT Services |
|
|
|
|
|
|
|
|
|
|
|
|
|
% |
||||||
IMA Financial Group, Inc. (7) |
|
Insurance |
|
|
|
|
|
|
|
|
|
|
|
|
|
% |
||||||
Imagefirst Holdings, LLC (7) |
|
Healthcare Providers and Services |
|
|
|
|
|
|
|
|
|
|
|
|
|
% |
||||||
Indicor, LLC (6) |
|
Software |
|
|
|
|
|
|
|
|
|
|
|
|
|
% |
||||||
Indy US Holdco, LLC (6) |
|
Media |
|
|
|
|
|
|
|
|
|
|
|
|
|
% |
||||||
Infinite Bidco, LLC (6) |
|
Electronic Equipment, Instruments and Components |
|
|
|
|
|
|
|
|
|
|
|
|
|
% |
||||||
Infinite Bidco, LLC |
|
Electronic Equipment, Instruments and Components |
|
|
|
|
|
|
|
|
|
|
|
|
|
% |
||||||
F-21
Palmer Square Capital BDC Inc.
Consolidated Schedules of Investments
As of December 31, 2023
Portfolio Company(3) |
|
Industry |
|
Interest Rate |
|
Maturity Date |
|
Principal / Par |
|
|
Amortized |
|
|
Fair Value |
|
|
Percentage of |
|
||||
Inmar, Inc. (6)(7) |
|
Professional Services |
|
|
|
|
|
|
|
|
|
|
|
|
|
% |
||||||
Invenergy Thermal Operating I LLC (7) |
|
Independent Power and Renewable Electricity Producers |
|
|
|
|
|
|
|
|
|
|
|
|
|
% |
||||||
Invenergy Thermal Operating I LLC (7) |
|
Independent Power and Renewable Electricity Producers |
|
|
|
|
|
|
|
|
|
|
|
|
|
% |
||||||
iSolved, Inc. (6) |
|
Software |
|
|
|
|
|
|
|
|
|
|
|
|
|
% |
||||||
Ivanti Software, Inc. (6) |
|
Software |
|
|
|
|
|
|
|
|
|
|
|
|
|
% |
||||||
Ivanti Software, Inc. (6) |
|
Software |
|
|
|
|
|
|
|
|
|
|
|
|
|
% |
||||||
IVC Acquisition, Ltd. (4)(6) |
|
Professional Services |
|
|
|
|
|
|
|
|
|
|
|
|
|
% |
||||||
Jack Ohio Finance LLC (7) |
|
Hotels, Restaurants and Leisure |
|
|
|
|
|
|
|
|
|
|
|
|
|
% |
||||||
Jones DesLauriers Insurance Management |
|
Insurance |
|
|
|
|
|
|
|
|
|
|
|
|
|
% |
||||||
Kestrel Acquisition, LLC (6) |
|
Independent Power and Renewable Electricity Producers |
|
|
|
|
|
|
|
|
|
|
|
|
|
% |
||||||
Kleopatra Finco S.a.r.l (4)(6) |
|
Containers and Packaging |
|
|
|
|
|
|
|
|
|
|
|
|
|
% |
||||||
LBM Acquisition LLC (6)(7) |
|
Building Products |
|
|
|
|
|
|
|
|
|
|
|
|
|
% |
||||||
Life Time, Inc. (4)(6) |
|
Hotels, Restaurants and Leisure |
|
|
|
|
|
|
|
|
|
|
|
|
|
% |
||||||
Lifescan Global Corporation (6) |
|
Healthcare Equipment and Supplies |
|
|
|
|
|
|
|
|
|
|
|
|
|
% |
||||||
Lightstone Holdco LLC (6) |
|
Independent Power and Renewable Electricity Producers |
|
|
|
|
|
|
|
|
|
|
|
|
|
% |
||||||
Lightstone Holdco LLC (6) |
|
Independent Power and Renewable Electricity Producers |
|
|
|
|
|
|
|
|
|
|
|
|
|
% |
||||||
LogMeIn, Inc. (6) |
|
IT Services |
|
|
|
|
|
|
|
|
|
|
|
|
|
% |
||||||
Magenta Buyer LLC (6) |
|
Software |
|
|
|
|
|
|
|
|
|
|
|
|
|
% |
||||||
Mariner Wealth Advisors, LLC (7) |
|
Diversified Financial Services |
|
|
|
|
|
|
|
|
|
|
|
|
|
% |
||||||
Maverick 1, LLC |
|
Software |
|
|
|
|
|
|
|
|
|
|
|
|
|
% |
||||||
Max US Bidco Inc. |
|
Food Products |
|
|
|
|
|
|
|
|
|
|
|
|
|
% |
||||||
Medical Solutions L.L.C. (7) |
|
Healthcare Providers and Services |
|
|
|
|
|
|
|
|
|
|
|
|
|
% |
||||||
F-22
Palmer Square Capital BDC Inc.
Consolidated Schedules of Investments
As of December 31, 2023
Portfolio Company(3) |
|
Industry |
|
Interest Rate |
|
Maturity Date |
|
Principal / Par |
|
|
Amortized Cost(1)(5) |
|
|
Fair Value |
|
|
Percentage of Net Assets |
|
||||
Mermaid Bidco, Inc. |
|
Software |
|
|
|
|
|
|
|
|
|
|
|
|
|
% |
||||||
Michael Baker International, LLC (7) |
|
Construction and Engineering |
|
|
|
|
|
|
|
|
|
|
|
|
|
% |
||||||
Micro Holding Corp. (6) |
|
IT Services |
|
|
|
|
|
|
|
|
|
|
|
|
|
% |
||||||
Midwest Veterinary Partners, LLC (6) |
|
Healthcare Providers and Services |
|
|
|
|
|
|
|
|
|
|
|
|
|
% |
||||||
Minotaur Acquisition, Inc. (6)(7) |
|
Diversified Financial Services |
|
|
|
|
|
|
|
|
|
|
|
|
|
% |
||||||
Mitchell International, Inc. (6) |
|
Professional Services |
|
|
|
|
|
|
|
|
|
|
|
|
|
% |
||||||
MLN US HoldCo LLC (6) |
|
Diversified Telecommunication Services |
|
|
|
|
|
|
|
|
|
|
|
|
|
% |
||||||
Momentive Performance Materials USA, LLC (6) |
|
Chemicals |
|
|
|
|
|
|
|
|
|
|
|
|
|
% |
||||||
NAPA Management Services Corporation (6) |
|
Healthcare Providers and Services |
|
|
|
|
|
|
|
|
|
|
|
|
|
% |
||||||
National Mentor Holdings, Inc. (6) |
|
Healthcare Providers and Services |
|
|
|
|
|
|
|
|
|
|
|
|
|
% |
||||||
National Mentor Holdings, Inc. (6) |
|
Healthcare Providers and Services |
|
|
|
|
|
|
|
|
|
|
|
|
|
% |
||||||
Navicure, Inc. (6) |
|
Healthcare Technology |
|
|
|
|
|
|
|
|
|
|
|
|
|
% |
||||||
Nexus Buyer LLC (6) |
|
Diversified Financial Services |
|
|
|
|
|
|
|
|
|
|
|
|
|
% |
||||||
NorthStar Group Services, Inc. (6)(7) |
|
Commercial Services and Supplies |
|
|
|
|
|
|
|
|
|
|
|
|
|
% |
||||||
NSM Top Holdings Corp. (6) |
|
Healthcare Equipment and Supplies |
|
|
|
|
|
|
|
|
|
|
|
|
|
% |
||||||
OMNIA Partners, LLC (6) |
|
Professional Services |
|
|
|
|
|
|
|
|
|
|
|
|
|
% |
||||||
OneDigital Borrower LLC (6) |
|
Insurance |
|
|
|
|
|
|
|
|
|
|
|
|
|
% |
||||||
Orchid Merger Sub II, LLC (4)(6) |
|
Software |
|
|
|
|
|
|
|
|
|
|
|
|
|
% |
||||||
Padagis, LLC (6) |
|
Pharmaceuticals |
|
|
|
|
|
|
|
|
|
|
|
|
|
% |
||||||
F-23
Palmer Square Capital BDC Inc.
Consolidated Schedules of Investments
As of December 31, 2023
Portfolio Company(3) |
|
Industry |
|
Interest Rate |
|
Maturity Date |
|
Principal / Par |
|
|
Amortized Cost(1)(5) |
|
|
Fair Value |
|
|
Percentage of Net Assets |
|
||||
Patriot Growth Insurance Services, LLC (7)(10) |
|
Insurance |
|
|
|
|
|
|
|
|
|
|
|
|
|
% |
||||||
PECF USS Intermediate Holding III Corporation (7) |
|
Professional Services |
|
|
|
|
|
|
|
|
|
|
|
|
|
% |
||||||
Peraton Corp. (7) |
|
Aerospace and Defense |
|
|
|
|
|
|
|
|
|
|
|
|
|
% |
||||||
PMHC II Inc. (6) |
|
Chemicals |
|
|
|
|
|
|
|
|
|
|
|
|
|
% |
||||||
Prairie ECI Acquiror LP (6) |
|
Oil, Gas and Consumable Fuels |
|
|
|
|
|
|
|
|
|
|
|
|
|
% |
||||||
Pretium PKG Holdings, Inc. |
|
Containers and Packaging |
|
|
|
|
|
|
|
|
|
|
|
|
|
% |
||||||
Pretium PKG Holdings, Inc. (6)(7) |
|
Containers and Packaging |
|
|
|
|
|
|
|
|
|
|
|
|
|
% |
||||||
Project Alpha Intermediate Holding, Inc. (6) |
|
Software |
|
|
|
|
|
|
|
|
|
|
|
|
|
% |
||||||
Project Boost Purchaser, LLC (6) |
|
Professional Services |
|
|
|
|
|
|
|
|
|
|
|
|
|
% |
||||||
Prometric Holdings, Inc. (6) |
|
Diversified Consumer Services |
|
|
|
|
|
|
|
|
|
|
|
|
|
% |
||||||
PS Holdco, LLC (7) |
|
Road and Rail |
|
|
|
|
|
|
|
|
|
|
|
|
|
% |
||||||
PT Intermediate Holdings III, LLC (7) |
|
Machinery |
|
|
|
|
|
|
|
|
|
|
|
|
|
% |
||||||
PT Intermediate Holdings III, LLC (7) |
|
Machinery |
|
|
|
|
|
|
|
|
|
|
|
|
|
% |
||||||
PT Intermediate Holdings III, LLC (7) |
|
Machinery |
|
|
|
|
|
|
|
|
|
|
|
|
|
% |
||||||
PT Intermediate Holdings III, LLC (7) |
|
Machinery |
|
|
|
|
|
|
|
|
|
|
|
|
|
% |
||||||
PT Intermediate Holdings III, LLC |
|
Machinery |
|
|
|
|
|
|
|
|
|
|
|
|
|
% |
||||||
Quest Software US Holdings Inc. (6) |
|
Software |
|
|
|
|
|
|
|
|
|
|
|
|
|
% |
||||||
Radiology Partners, Inc. (6) |
|
Healthcare Providers and Services |
|
|
|
|
|
|
|
|
|
|
|
|
|
% |
||||||
RC Buyer, Inc. (6) |
|
Auto Components |
|
|
|
|
|
|
|
|
|
|
|
|
|
% |
||||||
RealPage, Inc. (6) |
|
Real Estate Management and Development |
|
|
|
|
|
|
|
|
|
|
|
|
|
% |
||||||
RealTruck Group, Inc. |
|
Auto Components |
|
|
|
|
|
|
|
|
|
|
|
|
|
% |
||||||
RealTruck Group, Inc. (6) |
|
Auto Components |
|
|
|
|
|
|
|
|
|
|
|
|
|
% |
||||||
Red Planet Borrower, LLC (6) |
|
Internet Software and Services |
|
|
|
|
|
|
|
|
|
|
|
|
|
% |
||||||
F-24
Palmer Square Capital BDC Inc.
Consolidated Schedules of Investments
As of December 31, 2023
Portfolio Company(3) |
|
Industry |
|
Interest Rate |
|
Maturity Date |
|
Principal / Par |
|
|
Amortized Cost(1)(5) |
|
|
Fair Value |
|
|
Percentage of Net Assets |
|
||||
Redstone Holdco 2 LP (6)(7) |
|
IT Services |
|
|
|
|
|
|
|
|
|
|
|
|
|
% |
||||||
Refresco (4)(6) |
|
Food Products |
|
|
|
|
|
|
|
|
|
|
|
|
|
% |
||||||
Renaissance Holding Corp. (6) |
|
Software |
|
|
|
|
|
|
|
|
|
|
|
|
|
% |
||||||
Rocket Software, Inc. (6) |
|
Software |
|
|
|
|
|
|
|
|
|
|
|
|
|
% |
||||||
Rohm Holding GMBH (4)(6)(7) |
|
Chemicals |
|
|
|
|
|
|
|
|
|
|
|
|
|
% |
||||||
Runner Buyer Inc. (7) |
|
Household Durables |
|
|
|
|
|
|
|
|
|
|
|
|
|
% |
||||||
Ryan, LLC (7) |
|
Professional Services |
|
|
|
|
|
|
|
|
|
|
|
|
|
% |
||||||
Shearer's Foods, LLC (6) |
|
Food Products |
|
|
|
|
|
|
|
|
|
|
|
|
|
% |
||||||
Simon & Schuster, Inc. (6) |
|
Media |
|
|
|
|
|
|
|
|
|
|
|
|
|
% |
||||||
Sophia, L.P. (6) |
|
Software |
|
|
|
|
|
|
|
|
|
|
|
|
|
% |
||||||
Sovos Compliance, LLC (7) |
|
Software |
|
|
|
|
|
|
|
|
|
|
|
|
|
% |
||||||
Specialty Building Products Holdings, LLC (6)(7) |
|
Building Products |
|
|
|
|
|
|
|
|
|
|
|
|
|
% |
||||||
Summer BC Holdco B LLC (4)(7) |
|
Media |
|
|
|
|
|
|
|
|
|
|
|
|
|
% |
||||||
Talen Energy Supply, LLC (4)(6) |
|
Independent Power and Renewable Electricity Producers |
|
|
|
|
|
|
|
|
|
|
|
|
|
% |
||||||
Talen Energy Supply, LLC (4)(6) |
|
Independent Power and Renewable Electricity Producers |
|
|
|
|
|
|
|
|
|
|
|
|
|
% |
||||||
Tank Holding Corp. (11) |
|
Containers and Packaging |
|
|
|
|
|
|
|
|
|
|
|
|
|
% |
||||||
Tank Holding Corp. |
|
Containers and Packaging |
|
|
|
|
|
|
|
|
|
|
|
|
|
% |
||||||
Tank Holding Corp. |
|
Containers and Packaging |
|
|
|
|
|
|
|
|
|
|
|
|
|
% |
||||||
Tecta America Corp. (6)(7) |
|
Construction and Engineering |
|
|
|
|
|
|
|
|
|
|
|
|
|
% |
||||||
The Edelman Financial Center, LLC (6) |
|
Diversified Financial Services |
|
|
|
|
|
|
|
|
|
|
|
|
|
% |
||||||
F-25
Palmer Square Capital BDC Inc.
Consolidated Schedules of Investments
As of December 31, 2023
Portfolio Company(3) |
|
Industry |
|
Interest Rate |
|
Maturity |
|
Principal / Par |
|
|
Amortized Cost(1)(5) |
|
|
Fair Value |
|
|
Percentage of Net Assets |
|
||||
Thryv, Inc. (4)(6) |
|
Professional Services |
|
|
|
|
|
|
|
|
|
|
|
|
|
% |
||||||
Titan US Finco, LLC (4)(7) |
|
Media |
|
|
|
|
|
|
|
|
|
|
|
|
|
% |
||||||
Tosca Services, LLC (6) |
|
Containers and Packaging |
|
|
|
|
|
|
|
|
|
|
|
|
|
% |
||||||
Transnetwork, LLC (7) |
|
Diversified Financial Services |
|
|
|
|
|
|
|
|
|
|
|
|
|
% |
||||||
U.S. Renal Care, Inc. (6)(7) |
|
Healthcare Providers and Services |
|
|
|
|
|
|
|
|
|
|
|
|
|
% |
||||||
UKG Inc. (6) |
|
Software |
|
|
|
|
|
|
|
|
|
|
|
|
|
% |
||||||
US Radiology Specialists, Inc. (6) |
|
Healthcare Providers and Services |
|
|
|
|
|
|
|
|
|
|
|
|
|
% |
||||||
Veracode (6) |
|
Software |
|
|
|
|
|
|
|
|
|
|
|
|
|
% |
||||||
VeriFone Systems, Inc. (6) |
|
Commercial Services and Supplies |
|
|
|
|
|
|
|
|
|
|
|
|
|
% |
||||||
Verscend Holding Corp. (6) |
|
Healthcare Technology |
|
|
|
|
|
|
|
|
|
|
|
|
|
% |
||||||
Vision Solutions, Inc. (6) |
|
IT Services |
|
|
|
|
|
|
|
|
|
|
|
|
|
% |
||||||
Vocus Group DD T/L (4)(6) |
|
Diversified Telecommunication Services |
|
|
|
|
|
|
|
|
|
|
|
|
|
% |
||||||
WarHorse Gaming, LLC |
|
Hotels, Restaurants and Leisure |
|
|
|
|
|
|
|
|
|
|
|
|
|
% |
||||||
WaterBridge Midstream Operating, LLC (6) |
|
Energy Equipment and Services |
|
|
|
|
|
|
|
|
|
|
|
|
|
% |
||||||
Watlow Electric Manufacturing Company (6) |
|
Electrical Equipment |
|
|
|
|
|
|
|
|
|
|
|
|
|
% |
||||||
White Cap Buyer LLC (6) |
|
Building Products |
|
|
|
|
|
|
|
|
|
|
|
|
|
% |
||||||
Wilsonart LLC (6) |
|
Building Products |
|
|
|
|
|
|
|
|
|
|
|
|
|
% |
||||||
Total First Lien Senior Secured |
|
|
|
|
|
|
|
|
|
|
|
|
|
|
|
|
|
% |
||||
F-26
Palmer Square Capital BDC Inc.
Consolidated Schedules of Investments
As of December 31, 2023
Portfolio Company(3) |
|
Industry |
|
Interest Rate |
|
Maturity Date |
|
Principal / Par |
|
|
Amortized Cost(1)(5) |
|
|
Fair Value |
|
|
Percentage of Net Assets |
|
||||
Second Lien Senior Secured(2) |
|
|
|
|
|
|
|
|
|
|
|
|
|
|
|
|
|
|
||||
American Rock Salt Company LLC |
|
Metals and Mining |
|
|
|
|
|
|
|
|
|
|
|
|
|
% |
||||||
ARC Falcon I Inc. (6) |
|
Chemicals |
|
|
|
|
|
|
|
|
|
|
|
|
|
% |
||||||
Artera Services, LLC (6) |
|
Construction and Engineering |
|
|
|
|
|
|
|
|
|
|
|
|
|
% |
||||||
Aruba Investments, Inc. (6) |
|
Chemicals |
|
|
|
|
|
|
|
|
|
|
|
|
|
% |
||||||
Asurion, LLC (6) |
|
Insurance |
|
|
|
|
|
|
|
|
|
|
|
|
|
% |
||||||
Barracuda Networks, Inc. |
|
Software |
|
|
|
|
|
|
|
|
|
|
|
|
|
% |
||||||
DCert Buyer, Inc. (6) |
|
IT Services |
|
|
|
|
|
|
|
|
|
|
|
|
|
% |
||||||
Delta Topco, Inc. |
|
IT Services |
|
|
|
|
|
|
|
|
|
|
|
|
|
% |
||||||
Energy Acquisition LP |
|
Electrical Equipment |
|
|
|
|
|
|
|
|
|
|
|
|
|
% |
||||||
Gainwell Acquisition Corp. |
|
Healthcare Providers and Services |
|
|
|
|
|
|
|
|
|
|
|
|
|
% |
||||||
Help/Systems Holdings, Inc. |
|
Software |
|
|
|
|
|
|
|
|
|
|
|
|
|
% |
||||||
Idera, Inc. |
|
IT Services |
|
|
|
|
|
|
|
|
|
|
|
|
|
% |
||||||
Infinite Bidco, LLC (6) |
|
Electronic Equipment, Instruments and Components |
|
|
|
|
|
|
|
|
|
|
|
|
|
% |
||||||
Ivanti Software, Inc. |
|
Software |
|
|
|
|
|
|
|
|
|
|
|
|
|
% |
||||||
Magenta Buyer LLC |
|
Software |
|
|
|
|
|
|
|
|
|
|
|
|
|
% |
||||||
Paradigm Outcomes |
|
Healthcare Providers and Services |
|
|
|
|
|
|
|
|
|
|
|
|
|
% |
||||||
F-27
Palmer Square Capital BDC Inc.
Consolidated Schedules of Investments
As of December 31, 2023
Portfolio Company(3) |
|
Industry |
|
Interest Rate |
|
Maturity Date |
|
Principal / Par |
|
|
Amortized Cost(1)(5) |
|
|
Fair Value |
|
|
Percentage of Net Assets |
|
||||
Peraton Corp. |
|
Aerospace and Defense |
|
|
|
|
|
|
|
|
|
|
|
|
|
% |
||||||
Pretium PKG Holdings, Inc. (6) |
|
Containers and Packaging |
|
|
|
|
|
|
|
|
|
|
|
|
|
% |
||||||
Quest Software US Holdings Inc. |
|
Software |
|
|
|
|
|
|
|
|
|
|
|
|
|
% |
||||||
Vision Solutions, Inc. |
|
IT Services |
|
|
|
|
|
|
|
|
|
|
|
|
|
% |
||||||
Total Second Lien Senior Secured |
|
|
|
|
|
|
|
|
|
|
|
|
|
|
|
|
|
% |
||||
|
|
|
|
|
|
|
|
|
|
|
|
|
|
|
|
|
|
|
||||
Corporate Bonds |
|
|
|
|
|
|
|
|
|
|
|
|
|
|
|
|
|
|
||||
Altice Financing S.A. (4) |
|
Diversified Telecommunication Services |
|
|
|
|
|
|
|
|
|
|
|
|
|
% |
||||||
KOBE US Midco 2 Inc |
|
Chemicals |
|
|
|
|
|
|
|
|
|
|
|
|
|
% |
||||||
Total Corporate Bonds |
|
|
|
|
|
|
|
|
|
|
|
|
|
|
|
|
|
% |
||||
|
|
|
|
|
|
|
|
|
|
|
|
|
|
|
|
|
|
|
||||
Total Debt Investments |
|
|
|
|
|
|
|
$ |
|
|
$ |
|
|
$ |
|
|
|
% |
||||
|
|
|
|
|
|
|
|
|
|
|
|
|
|
|
|
|
|
|
||||
CLO Mezzanine(2) |
|
|
|
|
|
|
|
|
|
|
|
|
|
|
|
|
|
|
||||
522 Funding CLO 2020-6, Ltd. (4) |
|
Structured Note |
|
|
|
|
|
|
|
|
|
|
|
|
|
% |
||||||
Carlyle US CLO 2020-2, Ltd (4) |
|
Structured Note |
|
|
|
|
|
|
|
|
|
|
|
|
|
% |
||||||
Elmwood CLO III Ltd. (4) |
|
Structured Note |
|
|
|
|
|
|
|
|
|
|
|
|
|
% |
||||||
F-28
Palmer Square Capital BDC Inc.
Consolidated Schedules of Investments
As of December 31, 2023
Portfolio Company(3) |
|
Industry |
|
Interest Rate |
|
Maturity Date |
|
Principal / Par |
|
|
Amortized Cost(1)(5) |
|
|
Fair Value |
|
|
Percentage of Net Assets |
|
||||
GoldenTree Loan Management US 2020-7A (4) |
|
Structured Note |
|
|
|
|
|
|
|
|
|
|
|
|
|
% |
||||||
GoldenTree Loan Management US 2021-10A (4) |
|
Structured Note |
|
|
|
|
|
|
|
|
|
|
|
|
|
% |
||||||
GoldenTree Loan Management US 2021-9A (4) |
|
Structured Note |
|
|
|
|
|
|
|
|
|
|
|
|
|
% |
||||||
Thayer Park CLO, Ltd. (4) |
|
Structured Note |
|
|
|
|
|
|
|
|
|
|
|
|
|
% |
||||||
Total CLO Mezzanine |
|
|
|
|
|
|
|
|
|
|
|
|
|
|
|
|
|
% |
||||
|
|
|
|
|
|
|
|
|
|
|
|
|
|
|
|
|
|
|
||||
CLO Equity |
|
|
|
|
|
|
|
|
|
|
|
|
|
|
|
|
|
|
||||
Ares CLO Ltd 2021-62A (4) |
|
Structured Subordinated Note |
|
NA |
|
|
|
|
|
|
|
|
|
|
|
|
% |
|||||
Babson CLO 2018-4A, Ltd. (4) |
|
Structured Subordinated Note |
|
NA |
|
|
|
|
|
|
|
|
|
|
|
|
% |
|||||
Dryden 86 CLO, Ltd. (4) |
|
Structured Subordinated Note |
|
NA |
|
|
|
|
|
|
|
|
|
|
|
|
% |
|||||
HPS Loan Management 12-2018, Ltd. (4) |
|
Structured Subordinated Note |
|
NA |
|
|
|
|
|
|
|
|
|
|
|
|
% |
|||||
Long Point Park CLO, Ltd. (4) |
|
Structured Subordinated Note |
|
NA |
|
|
|
|
|
|
|
|
|
|
|
|
% |
|||||
Regatta XII Funding Ltd. (4) |
|
Structured Subordinated Note |
|
NA |
|
|
|
|
|
|
|
|
|
|
|
|
% |
|||||
Signal Peak CLO, LLC (4) |
|
Structured Subordinated Note |
|
NA |
|
|
|
|
|
|
|
|
|
|
|
|
% |
|||||
Stratus CLO Series 2021-1A (4) |
|
Structured Subordinated Note |
|
NA |
|
|
|
|
|
|
|
|
|
|
|
|
% |
|||||
Total CLO Equity |
|
|
|
|
|
|
|
|
|
|
|
|
|
|
|
|
|
% |
||||
Total Equity and Other Investments |
|
|
|
|
|
|
|
$ |
|
|
$ |
|
|
$ |
|
|
|
% |
||||
F-29
Palmer Square Capital BDC Inc.
Consolidated Schedules of Investments
As of December 31, 2023
|
|
Number of Shares |
|
|
Cost |
|
|
Fair Value |
|
|
Percentage of Net Assets |
|
||||
Short-Term Investments |
|
|
|
|
|
|
|
|
|
|
|
|
||||
Fidelity Investments Money Market Government Portfolio - Institutional Class, |
|
|
|
|
|
|
|
|
|
|
|
% |
||||
Total Short-Term Investments |
|
|
|
|
|
|
|
|
|
|
|
% |
||||
|
|
|
|
|
|
|
|
|
|
|
|
|
||||
Total Investments |
|
|
|
|
$ |
|
|
$ |
|
|
|
% |
||||
Liabilities in Excess of Other Assets |
|
|
|
|
|
|
|
|
( |
) |
|
|
( |
)% |
||
Net Assets |
|
|
|
|
|
|
|
$ |
|
|
|
% |
||||
The accompanying notes are an integral part of these consolidated financial statements.
F-30
Palmer Square Capital BDC Inc.
Notes to Consolidated Financial Statements
Note 1. Organization
Organization
Palmer Square Capital BDC Inc. (the “Company”) is a financial services company that primarily lends to and invests in corporate debt securities of companies, including small to large private U.S. companies. The Company was organized as a Maryland corporation on August 26, 2019 and is structured as an externally managed, non-diversified closed-end management investment company. The Company has elected to be regulated as a business development company (“BDC”) under the Investment Company Act of 1940, as amended (the “1940 Act”). Beginning with its taxable year ending December 31, 2020, the Company has elected to be treated as a regulated investment company (“RIC”) under Subchapter M of the Internal Revenue Code of 1986, as amended (the “Code”) and expects to qualify as a RIC each year thereafter. The Company commenced operations on January 23, 2020. Palmer Square BDC Funding I, LLC (“PS BDC Funding”) was formed on January 21, 2020 and entered into a senior, secured revolving credit facility with Bank of America, N.A. (“BofA N.A.”) Palmer Square BDC Funding II LLC (“PS BDC Funding II”) was formed on September 8, 2020 and entered into a senior, secured credit facility with Wells Fargo, National Association (“WFB”).
The Company’s investment objective is to maximize total return, comprised of current income and capital appreciation. The Company’s current investment focus is guided by two strategies that facilitate its investment opportunities and core competencies: (1) investing in corporate debt securities and, to a lesser extent, (2) investing in collateralized loan obligation (“CLO”) structured credit funds that typically own corporate debt securities, including the equity and junior debt tranches of CLOs. To a limited extent, the Company may enter into derivatives transactions, which may utilize instruments such as forward contracts, currency options and interest rate swaps, caps, collars and floors to seek to hedge against fluctuations in the relative values of the Company’s portfolio positions from changes in currency exchange rates and market interest rates or to earn income and enhance the Company’s total returns. The Company may receive or purchase warrants or rights to acquire equity or other securities in connection with making a debt investment in a company. During the years ended December 31, 2024, 2023, and 2022, the Company did not invest in any derivative contracts.
The Company is externally managed by Palmer Square BDC Advisor LLC (the “Investment Advisor”), an investment adviser that is registered with the Securities and Exchange Commission (the “SEC”) under the Investment Advisers Act of 1940, pursuant to an investment advisory agreement between the Company and the Investment Advisor (the “Advisory Agreement”). The Investment Advisor is a majority-owned subsidiary of Palmer Square Capital Management LLC (“PSCM”) and an investment adviser registered under the Investment Advisors Act of 1940, as amended (the “Advisers Act”). The Investment Advisor, in its capacity as administrator (the “Administrator”), provides the administrative services necessary for the Company to operate pursuant to an administration agreement between the Company and the Administrator (the “Administration Agreement”). The Company’s fiscal year ends on December 31.
The Company has four wholly-owned subsidiaries: PS BDC Funding, a special purpose wholly-owned subsidiary established for utilizing the Company’s revolving credit facility with BofA N.A.; PS BDC Funding II, a special purpose wholly-owned subsidiary established for utilizing the Company’s credit facility with WFB; Palmer Square BDC CLO 1, Ltd., a special purpose wholly-owned subsidiary established to be the Issuer in connection with the CLO Transaction (as defined below); and Palmer Square BDC CLO 1, LLC a special purpose indirect wholly-owned subsidiary established to be the Co-Issuer in connection with the CLO Transaction. These subsidiaries are consolidated in the financial statements of the Company.
On January 22, 2024, the Company completed its initial public offering (“IPO”), issuing
Note 2. Significant Accounting Policies
The Company is an investment company and applies specific accounting and financial reporting requirements under Financial Accounting Standards Board (“FASB”) Accounting Standards Topic 946, Financial Services-Investment Companies. The Company’s functional currency is U.S. dollars (“USD”) and these consolidated financial statements have been prepared in that currency. The accompanying consolidated financial statements have been prepared in accordance with accounting principles generally accepted in the United States of America (“GAAP”) and pursuant to Regulation S-X.
Use of Estimates
The preparation of the consolidated financial statements in conformity with GAAP requires management to make estimates and assumptions that affect the reported amounts of assets and liabilities and disclosure of contingent assets and liabilities at the date of the consolidated financial statements. Actual results could differ from those estimates.
Indemnifications
In the normal course of business, the Company enters into contracts that contain a variety of representations which provide general indemnifications. The Company’s maximum exposure under these arrangements cannot be known; however, the Company expects any risk of loss to be remote.
Cash and Cash Equivalents
Cash is comprised of cash on deposit with major financial institutions. Cash equivalents consist of highly liquid investments with original maturities of three months or less. The Company places its cash with high credit quality institutions to minimize credit risk exposure.
F-31
Debt Issuance Costs
The Company records origination and other expenses related to its debt obligations as deferred financing costs. These expenses are deferred and amortized over the life of the related debt instrument. Debt issuance costs are presented on the consolidated statements of assets and liabilities as a direct deduction from the debt liability. In circumstances in which there is not an associated debt liability amount recorded in the consolidated financial statements when the debt issuance costs are incurred, such debt issuance costs will be reported on the consolidated statements of assets and liabilities as an asset until the debt liability is recorded. As of December 31, 2024, the balance of debt issuance costs was $(
Income Taxes
The Company has elected to be treated as a RIC under Subchapter M of the Code. So long as the Company maintains its status as a RIC, it generally will not pay corporate-level U.S. federal income taxes on any ordinary income or capital gains that it distributes at least annually to its stockholders as dividends.
To qualify as a RIC, the Company must, among other things, meet certain source-of-income and asset diversification requirements. In addition, to qualify for RIC tax treatment, the Company must distribute to its stockholders, for each taxable year, at least
The Company evaluates tax positions taken or expected to be taken in the course of preparing its consolidated financial statements to determine whether the tax positions are “more-likely-than-not” to be sustained by the applicable tax authority. Tax positions not deemed to meet the “more-likely-than-not” threshold are reserved and recorded as a tax benefit or expense in the current year. All penalties and interest associated with income taxes are included in income tax expense. Conclusions regarding tax positions are subject to review and may be adjusted at a later date based on factors including, but not limited to, on-going analyses of tax laws, regulations and interpretations thereof.
Offering Costs
Offering costs in connection with the offering of common stock of the Company are capitalized as a deferred charge and amortized to expense on a straight-line basis over 12 months from the commencement of operations, January 23, 2020. These expenses consist primarily of legal fees and other costs incurred with the Company’s share offerings, the preparation of the Company’s registration statement, and registration fees.
Basis of Consolidation
As provided under ASC 946, the Company will generally not consolidate its investment in a company other than a substantially wholly owned investment company subsidiary or a controlled operating company whose business consists of providing services to the Company. Accordingly, the Company consolidated the results of the Company’s wholly owned investment company subsidiaries (PS BDC Funding, PS BDC Funding II and Palmer Square BDC CLO I, Ltd.) in its consolidated financial statements.
Interest and Dividend Income Recognition
Interest income is recorded on the accrual basis and includes amortization of premiums or accretion of discounts. Discounts and premiums to par value on securities purchased are accreted and amortized, respectively, into interest income over the contractual life of the respective security using the effective interest method. The amortized cost of investments represents the original cost adjusted for the amortization of premiums or accretion of discounts, if any. Upon prepayment of a loan or debt security, any prepayment premiums, unamortized upfront loan origination fees, paydown gains/losses and unamortized discounts are recorded as interest income in the current period.
Dividend income on preferred equity securities is recorded on the accrual basis to the extent that such amounts are payable by the portfolio company and are expected to be collected. Dividend income on common equity securities and money market funds is recorded on the record date for private portfolio companies or on the ex-dividend date for publicly traded portfolio companies.
Non-Accrual Status
Management reviews all loans that have principal or interest that is 90 days past due, or when there is reasonable doubt as to the collection of principal or interest to determine if a loan will be placed on non-accrual status. When a loan is placed on non-accrual status, the accrued interest and unpaid interest is generally reversed, and any discount (market or original) is no longer accreted to interest income. Interest payments received while a loan is on non-accrual status may be applied to principal or recognized as income, as determined by management’s judgment regarding collectability.
F-32
A loan may be taken off non-accrual status if past due payments are made, and if management determines the issuer is likely to remain current on future payments. Management may make exceptions to this policy if the loan has sufficient collateral value or is in the process of collection. Management may also leave a loan on accrual status while actively seeking recovery of past due payment. As of December 31, 2024, the Company had two loans on non-accrual status. As of December 31, 2024, loans on non-accrual status represented
Other Income
From time to time, the Company may receive fees for services provided to portfolio companies. These fees are generally only available to the Company as a result of closing investments, are normally paid at the closing of the investments, are generally non-recurring and are recognized as revenue when earned upon closing of the investment. The services that the Investment Advisor provides vary by investment, but can include closing, work, diligence or other similar fees and fees for providing managerial assistance to the Company’s portfolio companies. In addition, the Company may generate revenue in the form of commitment, origination, structuring or diligence fees, monitoring fees and possibly consulting and performance-based fees.
Net Realized Gains or Losses and Net Change in Unrealized Appreciation or Depreciation
The Company measures realized gains or losses by the difference between the net proceeds from the repayment or sale and the amortized cost basis of the investment, without regard to unrealized appreciation or depreciation previously recognized, but considering unamortized upfront fees and prepayment penalties. Net change in unrealized appreciation or depreciation reflects the change in portfolio investment values during the reporting period, including any reversal of previously recorded unrealized appreciation or depreciation, when gains or losses are realized.
Segments
An operating segment is defined in Topic 280 as a component of a public entity that engages in business activities from which it may recognize revenues and incur expenses, has operating results that are regularly reviewed by the public entity’s chief operating decision maker (“CODM”) to make decisions about resources to be allocated to the segment and assess its performance, and has discrete financial information available.
The Company represents a single operating and reporting segment with an investment objective to maximize total return, comprised of current income and capital appreciation. The Investment Committee of the Company’s Investment Advisor acts as the Company’s CODM. The CODM monitors the operating results of the Company as a whole and the Company’s long-term strategic asset allocation is pre-determined in accordance with the terms of its investment objective, which is outlined in “Business—Investment Criteria for Evaluating Potential Investment Opportunities” included in Item 1 of Part I of this Annual report on Form 10-K. The financial information provided to and reviewed by the CODM is consistent with that presented within the Company’s Schedule of Investments, Statement of Changes in Net Assets and Financial Highlights.
New Accounting Pronouncements
In November 2023, the FASB issued Accounting Standards Update 2023-07, Segment Reporting (Topic 280) - Improvements to Reportable Segment Disclosures (“ASU 2023-07”), which enhances disclosure requirements about significant segment expenses. ASU 2023-07 is effective for fiscal years beginning after December 15, 2023 and interim periods within fiscal years beginning after December 15, 2024. Adoption of the new standard impacted financial statement disclosures only and did not affect the Company’s financial position or the results of its operations.
Note 3. Agreements and Related Party Transactions
Administration Agreement
The Company has entered into the Administration Agreement with the Administrator. Pursuant to the Administration Agreement, the Administrator furnishes office facilities and equipment and provides clerical, bookkeeping, compliance, recordkeeping and other administrative services at such facilities. Under the Administration Agreement, the Administrator performs, or oversees the performance of, required administrative services, which include being responsible for the financial and other records that the Company is required to maintain and preparing reports to stockholders and reports and other materials filed with the SEC. In addition, the Administrator assists the Company in determining and publishing the Company’s net asset value (“NAV”), overseeing the preparation and filing of tax returns and the printing and dissemination of reports and other materials to stockholders, and generally overseeing the payment of expenses and the performance of administrative and professional services rendered to the Company by others. Under the Administration Agreement, the Administrator also provides managerial assistance on the Company’s behalf to those portfolio companies that have accepted the offer to provide such assistance.
Under the Administration Agreement, the Company reimburses the Administrator based upon its allocable portion of the Administrator’s overhead (including rent) in performing its obligations under the Administration Agreement, including the fees and expenses associated with performing compliance functions and the Company’s allocable portion of the cost of its officers (including the Company’s Chief Financial Officer and Chief Compliance Officer), and any of their respective staff who provide services to the Company, operations staff who provide services to the Company, and internal audit staff, if any, to the extent internal audit performs a role in the Company’s Sarbanes-Oxley internal control assessment. In addition, if requested to provide managerial assistance to portfolio companies, the Administrator is reimbursed based on the services provided. The Administration Agreement has an initial term of
F-33
In addition, the Administrator has, pursuant to a sub-administration agreement, engaged U.S. Bancorp Fund Services, LLC to act on behalf of the Company’s Administrator in the performance of certain other administrative services. The Company has also engaged Equiniti Trust Company, LLC or its affiliates (“Equiniti”) directly to serve as transfer agent, registrar and dividend disbursing agent and has engaged U.S. Bank National Association (“U.S. Bank”) or its affiliates directly to serve as custodian. Prior to the Company’s engagement of Equiniti upon the closing of the IPO, U.S. Bank served as the Company’s transfer agent, distribution paying agent and registrar.
Investment Advisory Agreement
The Investment Advisor serves as the investment adviser of the Company and is registered as an investment adviser with the SEC. The Investment Advisor’s primary business is to provide a variety of investment management services, including an investment program for the Company. The Investment Advisor is responsible for all business activities and oversight of the investment decisions made for the Company.
Subsequent to the IPO, in return for providing management services to the Company, the Company pays the Investment Advisor a base management fee, calculated and paid quarterly in arrears at an annual rate of
Prior to the IPO, the base management fee was
Additionally, pursuant to the Advisory Agreement, the Investment Advisor is not entitled to an incentive fee prior to the IPO because the Advisory Agreement provides that no incentive fee is payable prior to the listing of the Company’s common stock on a national securities exchange. Effective upon completion of the IPO, the Investment Advisor is entitled to an incentive fee (the “Income Incentive Fee”) based on the Company’s pre-incentive fee net investment income for the then most recently completed calendar quarter, as adjusted downward (but not upward) if over the most recently completed and eleven preceding calendar quarters since the IPO (or if shorter, the number of calendar quarters since the IPO) (each such period is referred to herein as the “Trailing Twelve Quarters”) aggregate net realized losses on the Company’s investments exceed the Company’s aggregate net investment income over the same period, excluding the most recently completed quarter, as described in more detail below. In this regard, if the Company’s net realized losses over the Trailing Twelve Quarters since the IPO (or if shorter, the number of calendar quarters since the IPO) are greater than the Company’s net investment income over the same period, excluding the most recently completed quarter, then the pre-incentive fee net income used in the calculation of the Income Incentive Fee would be subject to a downward adjustment. The amount of the adjustment would be equal to the amount by which such net realized losses exceed such net investment income. On the other hand, if the Company’s net investment income over the Trailing Twelve Quarters since the IPO (or if shorter, the number of calendar quarters since the IPO) is equal to or greater than the Company’s net realized losses over the same period, excluding the most recently completed quarter, then no adjustment to pre-incentive fee net investment income would be made. The Income Incentive Fee will be calculated and payable quarterly in arrears commencing with the first calendar quarter following the IPO. The Company will pay the Investment Advisor an Income Incentive Fee with respect to its “adjusted net investment income” in each calendar quarter as follows:
“Adjusted net investment income” means the Company’s “pre-incentive fee net investment income” during the then most recently completed calendar quarter minus the difference, if positive, between (i) the Company’s “net realized losses” over the then Trailing Twelve Quarters (or if shorter, the number of calendar quarters that have occurred since the IPO) and (ii) the Company’s “net investment income” over the Trailing Twelve Quarters (excluding the then most recently completed calendar quarter). No adjustment (downward or upward) will be made to “pre-incentive fee net investment income” if the difference between clause (i) minus clause (ii) is zero or negative.
“Pre-incentive fee net investment income” means interest income, dividend income and any other income (including any other fees such as commitment, origination, structuring, diligence and consulting fees or other fees that the Company receives from portfolio companies but excluding fees for providing managerial assistance) accrued during the calendar quarter, minus operating expenses for the quarter (including the base management fee, any expenses payable under the Administration Agreement, and any interest expense and dividends paid on any outstanding preferred stock, but excluding the Income Incentive Fee). “Pre-incentive fee net investment income” includes, in the case of investments with a deferred interest feature such as market discount, original issue discount (“OID”), debt instruments with payment-in-kind (“PIK”) interest, preferred stock with PIK dividends and zero-coupon securities, accrued income that the Company has not yet received in cash.
F-34
“Net realized losses” in respect of a particular period means the difference, if positive, between (i) the aggregate realized capital losses on the Company’s investments in such period and (ii) the aggregate realized capital gains on the Company’s investments in such period. “Net investment income” in respect of the particular period means interest income, dividend income and any other income (including any other fees such as commitment, origination, structuring, diligence and consulting fees or other fees that the Company receives from portfolio companies but excluding fees for providing managerial assistance) accrued during the particular period, minus operating expenses for the particular period (including the base management fee, the Income Incentive Fee, any expenses payable under the Administration Agreement, and any interest expense and dividends paid on any outstanding preferred stock). “Net investment income” includes, in the case of investments with a deferred interest feature such as market discount, OID, debt instruments with PIK interest, preferred stock with PIK dividends and zero-coupon securities, accrued income that the Company has not yet received in cash.
The Income Incentive Fee amount, or the calculations pertaining thereto, as appropriate, will be pro-rated for any period less than a full calendar quarter.
Effective upon completion of the IPO, the Investment Advisor has also agreed to use the most recently completed and three preceding calendar quarters (each such period is referred to herein as the “Trailing Four Quarters”) in addition to the Trailing Twelve Quarters to compute the incentive fee payable to it by the Company. In conjunction therewith, the Investment Advisor has agreed to calculate the incentive fee based on the Trailing Twelve Quarters and the Trailing Four Quarters and in the event that any Trailing Four Quarter period calculation produces a lower incentive fee as compared to the applicable Trailing Twelve Quarter period calculation for any quarterly period, then the Trailing Four Quarter Period will be used in connection with the calculation of the incentive fee payable to the Investment Advisor by the Company for such quarter.
The Investment Advisor has agreed to pay all offering costs in connection with the IPO. These expenses consist primarily of legal fees and other costs incurred with the Company’s share offerings, the preparation of the Company’s registration statement, and registration fees. The Company is not obligated to repay any such offering costs paid by our Investment Advisor.
Note 4. Investments
The following table presents the composition of the Company’s investment portfolio at amortized cost and fair value as of December 31, 2024 and December 31, 2023:
|
|
December 31, 2024 |
|
|
December 31, 2023 |
|
||||||||||
|
|
Amortized |
|
|
Fair |
|
|
Amortized |
|
|
Fair |
|
||||
|
|
Cost |
|
|
Value |
|
|
Cost |
|
|
Value |
|
||||
First-lien senior secured debt |
|
$ |
|
|
$ |
|
|
$ |
|
|
$ |
|
||||
Second-lien senior secured debt |
|
|
|
|
|
|
|
|
|
|
|
|
||||
Corporate Bonds |
|
|
|
|
|
|
|
|
|
|
|
|
||||
CLO Mezzanine |
|
|
|
|
|
|
|
|
|
|
|
|
||||
CLO Equity |
|
|
|
|
|
|
|
|
|
|
|
|
||||
Equity |
|
|
|
|
|
|
|
|
|
|
|
|
||||
Short-term investments |
|
|
|
|
|
|
|
|
|
|
|
|
||||
Total Investments |
|
$ |
|
|
$ |
|
|
$ |
|
|
$ |
|
||||
As of December 31, 2024, approximately
F-35
The industry composition of investments based on fair value, as a percentage of total investments at fair value, as of December 31, 2024 and December 31, 2023 was as follows:
|
|
December 31, |
|
|
December 31, |
|
||
Software |
|
|
% |
|
|
% |
||
Healthcare Providers and Services |
|
|
% |
|
|
% |
||
Professional Services |
|
|
% |
|
|
% |
||
IT Services |
|
|
% |
|
|
% |
||
Chemicals |
|
|
% |
|
|
% |
||
Insurance |
|
|
% |
|
|
% |
||
Short-Term Investments |
|
|
% |
|
|
% |
||
Construction and Engineering |
|
|
% |
|
|
% |
||
Diversified Financial Services |
|
|
% |
|
|
% |
||
Independent Power and Renewable Electricity Producers |
|
|
% |
|
|
% |
||
Hotels, Restaurants and Leisure |
|
|
% |
|
|
% |
||
Media |
|
|
% |
|
|
% |
||
Electronic Equipment, Instruments and Components |
|
|
% |
|
|
% |
||
Structured Note |
|
|
% |
|
|
% |
||
Diversified Consumer Services |
|
|
% |
|
|
% |
||
Auto Components |
|
|
% |
|
|
% |
||
Diversified Telecommunication Services |
|
|
% |
|
|
% |
||
Internet Software and Services |
|
|
% |
|
|
% |
||
Food Products |
|
|
% |
|
|
% |
||
Building Products |
|
|
% |
|
|
% |
||
Machinery |
|
|
% |
|
|
% |
||
Energy Equipment and Services |
|
|
% |
|
|
% |
||
Containers and Packaging |
|
|
% |
|
|
% |
||
Metals and Mining |
|
|
% |
|
|
% |
||
Aerospace and Defense |
|
|
% |
|
|
% |
||
Industrial Conglomerates |
|
|
% |
|
|
% |
||
Structured Subordinated Note |
|
|
% |
|
|
% |
||
Interactive Media Services |
|
|
% |
|
|
|
||
Electrical Equipment |
|
|
% |
|
|
% |
||
Wireless Telecommunication Services |
|
|
% |
|
|
% |
||
Real Estate Management and Development |
|
|
% |
|
|
% |
||
Road and Rail |
|
|
% |
|
|
% |
||
Healthcare Equipment and Supplies |
|
|
% |
|
|
% |
||
Commercial Services and Supplies |
|
|
% |
|
|
% |
||
Pharmaceuticals |
|
|
% |
|
|
% |
||
Electric Utilities |
|
|
% |
|
|
|
||
Specialty Retail |
|
|
% |
|
|
% |
||
Household Durables |
|
|
% |
|
|
% |
||
Oil, Gas and Consumable Fuels |
|
|
|
|
|
% |
||
Healthcare Technology |
|
|
|
|
|
% |
||
Total |
|
|
% |
|
|
% |
||
|
|
|
|
|
|
|
||
F-36
Note 5. Fair Value of Investments
Fair value is defined as the price that the Company would receive upon selling an investment or paying to transfer a liability in an orderly transaction to a market participant in the principal or most advantageous market for the investment. Accounting guidance emphasizes that valuation techniques maximize the use of observable market inputs and minimize the use of unobservable inputs.
Inputs refer broadly to the assumptions that market participants would use in pricing an asset or liability, including assumptions about risk. Inputs may be observable or unobservable. Observable inputs are inputs that reflect the assumptions market participants would use in pricing an asset or liability developed based on market data obtained from sources independent of the Company. Unobservable inputs are inputs that reflect the assumptions market participants would use in pricing an asset or liability developed based on the best information available in the circumstances. The valuation hierarchical levels are based upon the transparency of the inputs to the valuation of the investment as of the measurement date. The three levels are defined as follows:
Level 1 — Valuations based on quoted prices in active markets for identical assets or liabilities at the measurement date.
Level 2 — Valuations based on inputs other than quoted prices in active markets included in Level 1, which are either directly or indirectly observable at the measurement date. This category includes quoted prices for similar assets or liabilities in active markets, quoted prices for identical or similar assets or liabilities in non-active markets including actionable bids from third parties for privately held assets or liabilities, and observable inputs other than quoted prices such as yield curves and forward currency rates that are entered directly into valuation models to determine the value of derivatives or other assets or liabilities.
Level 3 — Valuations based on inputs that are unobservable and where there is little, if any, market activity at the measurement date.
Investments in private investment companies measured based upon NAV as a practical expedient to determine fair value are not required to be categorized in the fair value hierarchy. As of December 31, 2024 and as of December 31, 2023, there were no investments accounted for using the practical expedient.
The inputs for the determination of fair value may require significant management judgment or estimation and are based upon management’s assessment of the assumptions that market participants would use in pricing the assets or liabilities. These investments include debt and equity investments in private companies or assets valued using the market or income approach and may involve pricing models whose inputs require significant judgment or estimation because of the absence of any meaningful current market data for identical or similar investments. The inputs in these valuations may include, but are not limited to, capitalization and discount rates, beta and earnings before interest, taxes, depreciation, and amortization (“EBITDA”) multiples. The information may also include pricing information or broker quotes, which include a disclaimer that the broker would not be held to such a price in an actual transaction. The non-binding nature of consensus pricing and/or quotes accompanied by disclaimer would result in classification as Level 3 information, assuming no additional corroborating evidence.
Pricing inputs and weightings applied to determine fair value require subjective determination. Accordingly, valuations do not necessarily represent the amounts that may eventually be realized from sales or other dispositions of investments.
A financial instrument’s categorization within the valuation hierarchy is based upon the lowest level of input that is significant to the fair value measurement.
The following table presents the fair value hierarchy of investments as of December 31, 2024:
|
|
Fair Value Hierarchy as of December 31, 2024 |
|
|||||||||||||
Investments: |
|
Level 1 |
|
|
Level 2 |
|
|
Level 3 |
|
|
Total |
|
||||
First-lien senior secured debt |
|
$ |
|
|
$ |
|
|
$ |
|
|
$ |
|
||||
Second-lien senior secured debt |
|
|
|
|
|
|
|
|
|
|
|
|
||||
Corporate Bonds |
|
|
|
|
|
|
|
|
|
|
|
|
||||
CLO Mezzanine |
|
|
|
|
|
|
|
|
|
|
|
|
||||
CLO Equity |
|
|
|
|
|
|
|
|
|
|
|
|
||||
Equity |
|
|
|
|
|
|
|
|
|
|
|
|
||||
Short Term Investments |
|
|
|
|
|
|
|
|
|
|
|
|
||||
Total Investments |
|
$ |
|
|
$ |
|
|
$ |
|
|
$ |
|
||||
The following table presents the fair value hierarchy of investments as of December 31, 2023:
|
|
Fair Value Hierarchy as of December 31, 2023 |
|
|||||||||||||
Investments: |
|
Level 1 |
|
|
Level 2 |
|
|
Level 3 |
|
|
Total |
|
||||
First-lien senior secured debt |
|
$ |
|
|
$ |
|
|
$ |
|
|
$ |
|
||||
Second-lien senior secured debt |
|
|
|
|
|
|
|
|
|
|
|
|
||||
Corporate Bonds |
|
|
|
|
|
|
|
|
|
|
|
|
||||
CLO Mezzanine |
|
|
|
|
|
|
|
|
|
|
|
|
||||
CLO Equity |
|
|
|
|
|
|
|
|
|
|
|
|
||||
Short Term Investments |
|
|
|
|
|
|
|
|
|
|
|
|
||||
Total Investments |
|
$ |
|
|
$ |
|
|
$ |
|
|
$ |
|
||||
F-37
For the years ended December 31, 2024 and 2023, the Company did not recognize any transfers to or from Level 3.
Debt Not Carried at Fair Value
The fair value of the BoA Credit Facility, WF Credit Facility and CLO Transaction, which would be categorized as Level 3 within the fair value hierarchy as of December 31, 2024, approximates their respective carrying values because the BoA Credit Facility, WF Credit Facility and CLO Transaction each have variable interest based on selected short-term rates.
Note 6. Borrowings
In accordance with the 1940 Act, with certain limitations, BDCs are permitted to borrow amounts such that their asset coverage ratios, as defined in the 1940 Act, are at least
Bank of America Credit Facility
On February 18, 2020, the Company, through a special purpose wholly-owned subsidiary, PS BDC Funding (together with the Company, the “Borrowers”) entered into a Credit Agreement (as amended, the “Credit Agreement”) with certain financial institutions as lenders (“Lenders”), BofA N.A. as the Administrative Agent and BofA Securities, Inc. (“BofA Securities”), as Lead Arranger and Sole Book Manager, pursuant to which the Lenders agreed to provide the Company with a revolving line of credit (the “BoA Credit Facility”).
Debt obligations under the BoA Credit Facility consisted of the following as of December 31, 2024:
|
|
December 31, 2024 |
|
|||||||||||||
|
|
Aggregate |
|
|
Outstanding |
|
|
Amount |
|
|
Net |
|
||||
BoA Credit Facility |
|
$ |
|
|
$ |
|
|
$ |
|
|
$ |
|
||||
Total debt |
|
$ |
|
|
$ |
|
|
$ |
|
|
$ |
|
||||
Debt obligations under the BoA Credit Facility consisted of the following as of December 31, 2023:
|
|
December 31, 2023 |
|
|||||||||||||
|
|
Aggregate |
|
|
Outstanding |
|
|
Amount |
|
|
Net |
|
||||
BoA Credit Facility |
|
$ |
|
|
$ |
|
|
$ |
|
|
$ |
|
||||
Total debt |
|
$ |
|
|
$ |
|
|
$ |
|
|
$ |
|
||||
Average debt outstanding under the BoA Credit Facility during the year ended December 31, 2024, December 31, 2023 and December 31, 2022 was $
F-38
The loans under the BoA Credit Facility may be base rate loans or SOFR loans.
For the years ended December 31, 2024, 2023, and 2022, the components of interest expense with respect to the BoA Credit Facility were as follows:
|
|
For the Year Ended December 31, |
|
|||||||||
|
|
2024 |
|
|
2023 |
|
|
2022 |
|
|||
Interest expense |
|
$ |
|
|
$ |
|
|
$ |
|
|||
Amortization of debt issuance costs |
|
|
|
|
|
|
|
|
|
|||
Total interest expense |
|
$ |
|
|
$ |
|
|
$ |
|
|||
Average interest rate |
|
|
% |
|
|
% |
|
|
% |
|||
PS BDC Funding has pledged all of its assets to BofA N.A., in its capacity as Administrative Agent, to secure its obligations under the BoA Credit Facility. Both the Company and PS BDC Funding have made customary representations and warranties and are required to comply with various covenants, reporting requirements and other customary requirements for similar credit facilities. Borrowing under the BoA Credit Facility is subject to the leverage restrictions contained in the 1940 Act and PS BDC Funding complies with 1940 Act provisions relating to affiliated transactions and custody. The custodian of the assets pledged to BofA N.A. pursuant to the BoA Credit Facility is U.S. Bank. The obligations under the Credit Agreement may be accelerated upon the occurrence of an event of default under the Credit Agreement, including in the event of a change of control of PS BDC Funding or if the Investment Advisor ceases to serve as investment adviser to the Company.
Wells Fargo Credit Facility
On December 18, 2020, the Company, through a special purpose wholly-owned subsidiary, PS BDC Funding II (together with the Company, the “WF Borrowers”) entered into a Loan and Security Agreement (the “Loan Agreement”) with certain financial institutions as lenders (“WF Lenders”), WFB as the administrative agent and U.S. Bank, as Collateral Agent and Custodian, pursuant to which the WF Lenders agreed to provide the Company with a line of credit (the “WF Credit Facility”).
On December 18, 2023, the Company entered into an amendment to the WF Credit Facility (the “WF Credit Facility Fourth Amendment”) that amends the WF Credit Facility to, among other things: (i) increase the amount available for borrowing under the WF Credit Facility from $
Debt obligations under the WF Credit Facility consisted of the following as of December 31, 2024:
|
|
December 31, 2024 |
|
|||||||||||||
|
|
Aggregate |
|
|
Outstanding |
|
|
Amount |
|
|
Net |
|
||||
WF Credit Facility |
|
$ |
|
|
$ |
|
|
$ |
|
|
$ |
|
||||
Total debt |
|
$ |
|
|
$ |
|
|
$ |
|
|
$ |
|
||||
Debt obligations under the WF Credit Facility consisted of the following as of December 31, 2023:
|
|
December 31, 2023 |
|
|||||||||||||
|
|
Aggregate |
|
|
Outstanding |
|
|
Amount |
|
|
Net |
|
||||
WF Credit Facility |
|
$ |
|
|
$ |
|
|
$ |
|
|
$ |
|
||||
Total debt |
|
$ |
|
|
$ |
|
|
$ |
|
|
$ |
|
||||
Average debt outstanding under the WF Credit Facility during the years ended December 31, 2024, 2023, and 2022, was $
F-39
Prior to April 10, 2023, the loans under the WF Credit Facility may have been
As of April 10, 2023, the loans under the WF Credit Facility may be
For the years ended December 31, 2024, 2023, and 2022,
|
|
For the Year Ended December 31, |
|
|||||||||
|
|
2024 |
|
|
2023 |
|
|
2022 |
|
|||
Interest expense |
|
$ |
|
|
$ |
|
|
$ |
|
|||
Amortization of debt issuance costs |
|
|
|
|
|
|
|
|
|
|||
Total interest expense |
|
$ |
|
|
$ |
|
|
$ |
|
|||
Average interest rate |
|
|
% |
|
|
% |
|
|
% |
|||
PS BDC Funding II has pledged all of its assets to U.S. Bank, in its capacity as Collateral Agent, to secure its obligations under the WF Credit Facility and U.S. Bank acts as the custodian of such assets. Both the Company and PS BDC Funding II have made customary representations and warranties and are required to comply with various covenants, reporting requirements, and other customary requirements for similar credit facilities. Borrowing under the WF Credit Facility is subject to the leverage restrictions contained in the 1940 Act and PS BDC Funding II complies with 1940 Act provisions relating to affiliated transactions and custody. The obligations under the Loan Agreement may be accelerated upon the occurrence of an event of default under the Loan Agreement, including in the event of a change of control of PS BDC Funding II, if the Investment Advisor ceases to serve as investment adviser to the Company, or if PSCM or its affiliates cease to directly or indirectly own a majority of the membership interests of the Investment Advisor.
CLO Transaction
On May 23, 2024 (the “Closing Date”), the Company completed a $
The notes offered in the CLO Transaction were issued by Palmer Square BDC CLO 1, Ltd. (the “Issuer”), an exempted company incorporated with limited liability under the laws of the Cayman Islands and a wholly-owned indirect subsidiary of the Company, and consist of
F-40
The following table presents information on the Notes issued in the CLO Transaction:
|
|
|
|
December 31, 2024 |
||||||
Description |
|
Type |
|
Principal Outstanding |
|
|
Interest Rate |
|
Credit Rating |
|
Class A Notes |
|
Senior Secured Floating Rate |
|
$ |
|
|
SOFR + ( |
|
||
Class B-1 Notes |
|
Senior Secured Floating Rate |
|
|
|
|
SOFR + ( |
|
||
Class B-2 Notes |
|
Senior Secured Fixed Rate |
|
|
|
|
( |
|
||
Total Secured Notes |
|
|
|
$ |
|
|
|
|
|
|
Subordinated Notes (1) |
|
|
|
|
|
|
|
|||
Total Notes |
|
|
|
$ |
|
|
|
|
|
|
On the Closing Date and in connection with the CLO Transaction, the Issuer and the Company entered into a note purchase agreement (the “Purchase Agreement”) with BofA Securities, Inc., as the initial purchaser (the “Initial Purchaser”), pursuant to which the Initial Purchaser purchased the Secured Notes issued pursuant to an indenture as part of the CLO Transaction.
The CLO Transaction is backed by a diversified portfolio of senior secured loans or participation interests therein with the potential for investment in second lien loans or participation interests therein, corporate bonds or loans made to a debtor-in-possession pursuant to Section 364 of the Bankruptcy Code having the priority allowed by either Section 364(c) or 364(d) of the Bankruptcy Code and fully secured by senior liens or participation interests therein, which is managed by the Company as collateral manager pursuant to a collateral management agreement entered into with the Issuer on the Closing Date (the “Collateral Management Agreement”). The Company has agreed to irrevocably waive all collateral management fees payable to it so long as it is the collateral manager under the Collateral Management Agreement. The Notes are scheduled to mature on July 15, 2037; however, the Notes may be redeemed by the Issuer, at the written direction of (i) a majority of the Subordinated Notes (with the consent of the Company, in the case of the Secured Notes) or (ii) the Company, in each case, on any business day on or after July 15, 2026.
The Secured Notes are the secured obligations of the Issuer, the Subordinated Notes are the unsecured obligations of the Issuer, and the indenture governing the Notes includes customary covenants and events of default. The Notes have not been, and will not be, registered under the Securities Act of 1933, as amended, or any state securities or “blue sky” laws and may not be offered or sold in the United States absent registration with the Securities and Exchange Commission or an applicable exemption from registration.
For the year ended December 31, 2024
|
|
For the Year Ended December 31, |
|
|
|
|
2024 |
|
|
Interest expense |
|
$ |
|
|
Amortization of debt issuance costs |
|
|
|
|
Total interest expense |
|
$ |
|
|
Average interest rate |
|
|
% |
|
F-41
Senior Securities
Information about the Company’s senior securities is shown in the following table for the fiscal years ended December 31, 2024, 2023, 2022, 2021 and 2020 (in thousands).
Class and Period Ended |
|
Total Amount Outstanding Exclusive of Treasury Securities(1) ($ in Millions) |
|
Asset Coverage per Unit(2) |
|
Involuntary Liquidating Preference per Unit(3) |
|
Average Market Value per Unit(4) |
BoA Credit Facility |
|
|
|
|
|
|
|
|
December 31, 2024 |
|
$ |
|
$ |
|
— |
|
— |
December 31, 2023 |
|
|
|
|
||||
December 31, 2022 |
|
|
|
|
||||
December 31, 2021 |
|
|
|
|
||||
December 31, 2020 |
|
|
|
|
||||
WF Credit Facility |
|
|
|
|
|
|
|
|
December 31, 2024 |
|
$ |
|
$ |
|
— |
|
— |
December 31, 2023 |
|
|
|
|
||||
December 31, 2022 |
|
|
|
|
||||
December 31, 2021 |
|
|
|
|
||||
December 31, 2020 |
|
|
|
|
||||
CLO Notes |
|
|
|
|
|
|
|
|
December 31, 2024 |
|
$ |
|
$ |
|
— |
|
— |
December 31, 2023 |
|
|
|
|
||||
December 31, 2022 |
|
|
|
|
||||
December 31, 2021 |
|
|
|
|
||||
December 31, 2020 |
|
|
|
|
F-42
Note 7. Share Transactions
Offering Proceeds
During the twelve months ended December 31, 2024 , 2023, and 2022 the Company issued and sold
Distribution Reinvestment Plan
The Company has adopted a dividend reinvestment plan that provides for reinvestment of its dividends and other distributions on behalf of the Company’s stockholders, unless a stockholder elects to receive cash. As a result, if the Company’s Board authorizes, and the Company declares, a cash dividend or other distribution, then stockholders who do not “opt out” of the Company’s dividend reinvestment plan will have their cash dividends and distributions automatically reinvested in additional shares of the Company’s common stock, rather than receiving cash dividends and distributions.
Prior to the IPO, the Board primarily used newly-issued shares of the Company’s common stock to implement the dividend reinvestment plan. The number of shares of common stock to be issued to a participant prior to the IPO would be equal to the quotient determined by dividing the cash value of the dividend payable to such stockholder by the NAV per share as of the date such dividend was declared.
After the IPO, the Board intends to primarily use newly-issued shares to implement the dividend reinvestment plan, whether or not the shares are trading at a price per share at, below or above NAV. However, the Board reserves the right to purchase shares in the open market in connection with the implementation of the dividend reinvestment plan. The Board will examine the full facts and circumstances of each such dividend to determine the approach (i.e., to use newly issued shares or effectuate open market purchases to implement the dividend reinvestment plan) that is in the best interests of stockholders taking into account the Board’s fiduciary duties to stockholders, including by weighing the potential dilution in connection with such issuance to be incurred by the Company’s stockholders against the Company’s need and usage of reinvested funds, and, if the Company uses newly issued shares to implement the dividend reinvestment plan at a time when the shares are trading at a price below NAV, the stockholders’ receipt of fewer shares than they would have if the Company had effectuated open market purchases. The number of newly issued shares to be issued to a participant would be determined by dividing the total dollar amount of the dividend payable to such stockholder by the market price per share of the Company’s common stock at the close of regular trading on a national securities exchange on the dividend payment date. Shares purchased in open market transactions by Equiniti, the plan administrator and the Company’s transfer agent, registrar and dividend disbursing agent, will be allocated to a participant based upon the average purchase price, excluding any brokerage charges or other charges, of all shares of the Company’s common stock purchased with respect to the dividend.
A registered stockholder may elect to receive an entire distribution in cash by notifying Equiniti in writing so that such notice is received by the plan administrator no later than the record date for distributions to stockholders. The plan administrator will set up an account for shares acquired through the plan for each stockholder who has not elected to receive dividends or other distributions in cash and hold such shares in noncertificated form.
There will be no brokerage charges or other charges to stockholders who participate in the plan. The plan administrator’s fees will be paid by the Company.
Stockholders who receive dividends and other distributions in the form of stock are generally subject to the same U.S. federal, state and local tax consequences as are stockholders who elect to receive their distributions in cash. However, since a participating stockholder’s cash dividends will be reinvested, such stockholder will not receive cash with which to pay any applicable taxes on reinvested dividends. A stockholder’s basis for determining gain or loss upon the sale of stock received in a dividend or other distribution from the Company will generally be equal to the total dollar amount of the distribution payable to the stockholder. Any stock received in a dividend or other distribution will have a new holding period for tax purposes commencing on the day following the day on which the shares are credited to the U.S. stockholder’s account.
Participants may terminate their accounts under the plan by so notifying the plan administrator by submitting a letter of instruction terminating the participant’s account under the plan to Equiniti. The plan may be terminated by the Company upon notice in writing mailed to each participant at least 30 days prior to any record date for the payment of any dividend by the Company.
If participants withdraw from the plan or the plan is terminated, the plan administrator will cause the shares held for the participant under the plan to be delivered to the participant. If an investor holds common stock with a brokerage firm that does not participate in the plan, such investor will not be able to participate in the plan and any dividend reinvestment may be affected on different terms than those described above.
For the year ended December 31, 2024, the Company issued
Open Market Share Repurchase Plan
The Board authorized the Company to repurchase shares of its common stock through an open-market share repurchase program for up to $
The Company Rule 10b5-1 Stock Repurchase Plan is intended to allow the Company to repurchase shares of its common stock at times when it otherwise might be prevented from doing so under insider trading laws. The Company Rule 10b5-1 Stock Repurchase Plan will require the Company’s agent to repurchase shares of the Company’s common stock on the Company’s behalf when the market price per share of the Company’s common stock is below the most recently reported NAV per share of common stock. Under the Company Rule 10b5-1 Stock Repurchase Plan, the agent will increase the volume of purchases made as the price of the Company’s common stock declines, subject to volume restrictions.
F-43
The repurchase of shares pursuant to the Company Rule 10b5-1 Stock Repurchase Plan is intended to satisfy the conditions of Rule 10b5-1 and Rule 10b-18 under the Exchange Act and will otherwise be subject to applicable law, including Regulation M, which may prohibit purchases under certain circumstances.
The Company Rule 10b5-1 Stock Repurchase Plan commenced on March 23, 2024, beginning 60 calendar days following the end of the “restricted period” under Regulation M, and will terminate upon the earliest to occur of (i) 12 months from the date of the Company Rule 10b5-1 Stock Repurchase Plan, (ii) the end of the trading day on which the aggregate purchase price for all shares purchased under the Company Rule 10b5-1 Stock Repurchase Plan equals $
For the year ended December 31, 2024, the Company repurchased
PSCM Rule 10b5-1 Stock Purchase Plan
In addition, PSCM will purchase up to $
The PSCM Rule 10b5-1 Stock Purchase Plan is intended to allow PSCM to purchase shares of the Company’s common stock at times when it otherwise might be prevented from doing so under insider trading laws. The PSCM Rule 10b5-1 Stock Purchase Plan will require PSCM’s agent to purchase shares of common stock on PSCM’s behalf when the market price per share of the Company’s common stock is trading below the most recently reported NAV per share of common stock. Under the PSCM Rule 10b-1 Stock Purchase Plan, the agent will increase the volume of purchases made as the price of the Company’s common stock declines, subject to volume restrictions.
The purchase of shares pursuant to the PSCM Rule 10b5-1 Stock Purchase Plan is intended to satisfy the conditions of Rule 10b5-1 and Rule 10b-18 under the Exchange Act, and will otherwise be subject to applicable law, including Regulation M, which may prohibit purchases under certain circumstances.
The PSCM Rule 10b5-1 Stock Purchase Plan commenced on March 23, 2024 and will terminate upon the earliest to occur of (i) 12 months from the date of the PSCM Rule 10b5-1 Stock Purchase Plan, (ii) the end of the trading day on which the aggregate purchase price for all shares purchased under the PSCM Rule 10b5-1 Stock Purchase Plan equals $
For the year ended December 31, 2024, PSCM did not repurchase any shares of the Company’s common stock pursuant to the PSCM Rule 10b5-1 Stock Purchase Plan.
Note 8. Dividends and Distributions
The Company’s dividends and distributions are recorded on the ex-dividend date.
Date Declared |
|
Record Date |
|
Payment Date |
|
Amount Per Share |
|
|
|
Cash Distribution |
|
|
DRIP Shares Issued |
|
|
DRIP Shares Value |
|
|
|||||||
|
|
|
$ |
|
|
|
|
$ |
|
|
|
|
|
|
$ |
|
|
(1) |
|||||||
|
|
|
|
|
|
|
|
|
|
|
|
|
|
|
|
|
|
(2) |
|||||||
|
|
|
|
|
|
|
|
|
|
|
|
|
|
|
|
|
|
(2) |
|||||||
|
|
|
|
|
|
|
|
|
|
|
|
|
|
|
|
|
|
(3) |
|||||||
|
|
|
|
|
|
|
|
|
|
|
|
|
|
|
|
|
|
(3) |
|||||||
|
|
|
|
|
|
|
|
|
|
|
|
|
- |
|
|
|
|
- |
|
|
|||||
|
|
|
|
|
|
|
|
|
|
|
|
|
- |
|
|
|
|
- |
|
|
|||||
F-44
Note 9. Commitments and Contingencies
As of December 31, 2024 and December 31, 2023, the Company had an aggregate of $
A summary of the composition of the unfunded commitments as of December 31, 2024 is shown in the table below:
|
|
|
|
|
|
|
|
|
Expiration Date (1) |
|
As of |
|
|
American Rock Salt Company LLC |
|
|
$ |
|
||
Aptean Inc. |
|
|
|
|
||
Aptean Inc. |
|
|
|
|
||
Aramsco, Inc. |
|
|
|
|
||
B'Laster Holdings, LLC |
|
|
|
|
||
Dwyer Instruments, LLC |
|
|
|
|
||
Dwyer Instruments, LLC |
|
|
|
|
||
Enverus Holdings, Inc. |
|
|
|
|
||
Enverus Holdings, Inc. |
|
|
|
|
||
Everest SubBidCo |
|
|
|
|
||
Galway Borrower LLC |
|
|
|
|
||
Galway Borrower LLC |
|
|
|
|
||
GS AcquisitionCo, Inc. |
|
|
|
|
||
GS AcquisitionCo, Inc. |
|
|
|
|
||
Logrhythm, Inc. |
|
|
|
|
||
Minotaur Acquisition, Inc. |
|
|
|
|
||
Minotaur Acquisition, Inc. |
|
|
|
|
||
MRI Software LLC |
|
|
|
|
||
Optimizely North America Inc. |
|
|
|
|
||
Patriot Growth Insurance Services, LLC |
|
|
|
|
||
PT Intermediate Holdings III, LLC |
|
|
|
|
||
Tank Holding Corp. |
|
|
|
|
||
TMC Buyer, Inc. |
|
|
|
|
||
US Fertility Enterprises, LLC |
|
|
|
|
||
USIC Holdings, Inc. |
|
|
|
|
||
USIC Holdings, Inc. |
|
|
|
|
||
Total unfunded commitments |
|
|
|
$ |
|
|
F-45
A summary of the composition of the unfunded commitments as of December 31, 2023 is shown in the table below:
|
|
Expiration Date (1) |
|
As of |
|
|
Accession Risk Management Group, Inc. |
|
|
$ |
|
||
Aptean Inc. |
|
|
|
|
||
Aptean Inc. |
|
|
|
|
||
Aramsco, Inc. |
|
|
|
|
||
B'Laster Holdings, LLC |
|
|
|
|
||
Enverus Holdings, Inc. |
|
|
|
|
||
Enverus Holdings, Inc. |
|
|
|
|
||
ImageFirst Holdings, LLC |
|
|
|
|
||
MRI Software LLC |
|
|
|
|
||
MRI Software LLC |
|
|
|
|
||
OMNIA Partners, LLC |
|
|
|
|
||
Patriot Growth Insurance Services, LLC |
|
|
|
|
||
PT Intermediate Holdings III, LLC |
|
|
|
|
||
Ryan, LLC |
|
|
|
|
||
Tank Holding Corp. |
|
|
|
|
||
Total unfunded commitments |
|
|
|
$ |
|
|
From time to time, the Company may become a party to certain legal proceedings incidental to the normal course of its business. As of December 31, 2024, management is not aware of any pending or threatened litigation.
Note 10. Earnings Per Share
In accordance with the provisions of ASC Topic 260, Earnings per Share (“ASC 260”), basic earnings per share is computed by dividing earnings available to common stockholders by the weighted average number of shares outstanding during the period. Other potentially dilutive common shares, and the related impact to earnings, are considered when calculating earnings per share on a diluted basis. As of each of December 31, 2024, 2023, and 2022, there were no dilutive shares.
The following table sets forth the computation of basic and diluted earnings per share of common stock for the years ended December 31, 2024, 2023, and 2022:
|
|
For the Year Ended December 31, |
|
|||||||||
|
|
2024 |
|
|
2023 |
|
|
2022 |
|
|||
Net increase (decrease) in net assets resulting from operations |
|
$ |
|
|
$ |
|
|
$ |
( |
) |
||
Weighted average shares of common stock outstanding - basic and diluted |
|
|
|
|
|
|
|
|
|
|||
Earnings (loss) per share of common stock - basic and diluted |
|
$ |
|
|
$ |
|
|
$ |
( |
) |
||
Note 11. Income Taxes
The Company intends to continue to qualify annually as a RIC under the Internal Revenue Code (“Code”). As a RIC, the Company is not subject to federal income tax on the portion of its taxable income and gains distributed currently to its stockholders as a dividend. The Company anticipates distributing substantially all of its taxable income and gains, within the Subchapter M rules, and thus the Company anticipates that it will not incur any federal or state income tax at the RIC level. As a RIC, the Company is also subject to a federal excise tax based on distributive requirements of its taxable income on a calendar year basis. Depending on the level of taxable income earned in a tax year, the Company may choose to carry forward taxable income in excess of current year distributions into the next tax year and pay a
The permanent differences for tax purposes from distributable earnings to additional paid in capital were reclassified for tax purposes for the tax years ended December 31, 2024, 2023, and 2022. These reclassifications have no impact on net assets.
|
|
Year Ended December 31, |
|
|||||||||
|
|
2024 |
|
|
2023 |
|
|
2022 |
|
|||
Increase (decrease) in distributable earnings |
|
$ |
|
|
$ |
|
|
$ |
|
|||
Increase (decrease) in capital in excess of par value |
|
$ |
|
|
$ |
|
|
$ |
|
|||
F-46
The following reconciles net increase in net assets resulting from operations to taxable income for the years ended December 31, 2024, 2023, and 2022:
|
|
Year Ended December 31, |
|
|||||||||
|
|
2024 |
|
|
2023 |
|
|
2022 |
|
|||
Net increase (decrease) in net assets resulting from operations |
|
$ |
|
|
$ |
|
|
$ |
( |
) |
||
Net change in unrealized appreciation (depreciation) from investments |
|
|
( |
) |
|
|
( |
) |
|
|
|
|
Other book tax differences |
|
|
|
|
|
|
|
|
|
|||
Taxable income before deductions for distributions |
|
$ |
|
|
$ |
|
|
$ |
|
|||
|
|
Year Ended December 31, |
|
|||||||||
|
|
2024 |
|
|
2023 |
|
|
2022 |
|
|||
Distributions paid from: |
|
|
|
|
|
|
|
|
|
|||
Ordinary income |
|
$ |
|
|
$ |
|
|
$ |
|
|||
Capital gains |
|
|
|
|
|
|
|
|
|
|||
Return of Capital |
|
|
|
|
|
|
|
|
|
|||
Total |
|
$ |
|
|
$ |
|
|
$ |
|
|||
For the years ended December 31, 2024, 2023, and 2022, the components of accumulated earnings on a tax basis were as follows:
|
|
Year Ended December 31, 2024 |
|
|
Year Ended December 31, 2023 |
|
|
Year Ended December 31, 2022 |
|
|||
Undistributed net investment income (loss) |
|
$ |
|
|
$ |
|
|
$ |
|
|||
Undistributed capital gains |
|
|
|
|
|
|
|
|
|
|||
Capital loss carryforward |
|
|
( |
) |
|
|
( |
) |
|
|
|
|
Other accumulated gain (loss) |
|
|
( |
) |
|
|
( |
) |
|
|
( |
) |
Net unrealized appreciation (depreciation) |
|
|
( |
) |
|
|
( |
) |
|
|
( |
) |
Total |
|
$ |
( |
) |
|
$ |
( |
) |
|
$ |
( |
) |
Capital losses can be carried forward indefinitely to offset future capital gains. As of December 31, 2024 and 2023, the Company had $
As of December 31, 2024, 2023, and 2022, the Company’s aggregate unrealized appreciation and depreciation on investments based on cost for U.S. federal income tax purposes was as follows:
|
|
Year Ended December 31, 2024 |
|
|
Year Ended December 31, 2023 |
|
|
Year Ended December 31, 2022 |
|
|||
Tax cost |
|
$ |
|
|
$ |
|
|
$ |
|
|||
Gross unrealized appreciation |
|
|
|
|
|
|
|
|
|
|||
Gross unrealized depreciation |
|
|
( |
) |
|
|
( |
) |
|
|
( |
) |
Net unrealized appreciation/(depreciation) on investments |
|
$ |
( |
) |
|
$ |
( |
) |
|
$ |
( |
) |
The Company adopted FASB ASC Topic 740, Accounting for Uncertainty in Income Taxes (“ASC 740”) as of January 23, 2020, commencement of operations. ASC 740 provides guidance for how uncertain tax positions should be recognized, measured, presented, and disclosed in the consolidated financial statements. ASC 740 requires the evaluation of tax positions taken or expected to be taken in the course of preparing the Company’s tax returns to determine whether the tax positions are “more-likely-than-not” of being sustained by the applicable tax authority. The Company recognizes the tax benefits of uncertain tax positions only where the position is “more likely than not” to be sustained assuming examination by tax authorities. As of December 31, 2024, management has analyzed the Company’s tax positions, and has concluded that no liability for unrecognized tax benefits should be recorded related to uncertain tax positions taken in the Company’s current year tax return. The Company identifies its major tax jurisdiction as U.S. Federal. The 2020-2024 tax years remain subject to examination by U.S. federal, state and local authorities. Management’s determinations regarding ASC 740 may be subject to review and adjustment at a later date based upon factors including, but not limited to, an ongoing analysis of tax laws, regulations and interpretations thereof.
F-47
Note 12. Financial Highlights
The following per share of common stock data has been derived from information provided in the consolidated financial statements. The following is a schedule of financial highlights for the years ended December 31, 2024, 2023, 2022, and 2021, and for the period January 23, 2020 (Commencement of Operations) through December 31, 2020:
|
|
|
|
|
|
|
|
|
|
|
|
|
|
For the Period January 23, 2020 (Commencement of Operations) through |
|
|||||
|
|
For the Year Ended December 31, |
|
|
December 31, |
|
||||||||||||||
|
|
2024 |
|
|
2023 |
|
|
2022 |
|
|
2021 |
|
|
2020 |
|
|||||
Per Common Share Operating Performance |
|
|
|
|
|
|
|
|
|
|
|
|
|
|
|
|||||
Net Asset Value, Beginning of Period |
|
$ |
|
|
$ |
|
|
$ |
|
|
$ |
|
|
$ |
|
|||||
|
|
|
|
|
|
|
|
|
|
|
|
|
|
|
|
|||||
Results of Operations: |
|
|
|
|
|
|
|
|
|
|
|
|
|
|
|
|||||
Net Investment Income(1) |
|
|
|
|
|
|
|
|
|
|
|
|
|
|
|
|||||
Net Realized and Unrealized Gain (Loss) on Investments(4) |
|
|
( |
) |
|
|
|
|
|
( |
) |
|
|
( |
) |
|
|
( |
) |
|
Net Increase (Decrease) in Net Assets Resulting from Operations |
|
|
|
|
|
|
|
|
( |
) |
|
|
|
|
|
|
||||
|
|
|
|
|
|
|
|
|
|
|
|
|
|
|
|
|||||
Distributions to Common Stockholders |
|
|
|
|
|
|
|
|
|
|
|
|
|
|
|
|||||
Distributions from Net Investment Income |
|
|
( |
) |
|
|
( |
) |
|
|
( |
) |
|
|
( |
) |
|
|
( |
) |
Distributions from Realized Gains |
|
|
|
|
|
|
|
|
( |
) |
|
|
( |
) |
|
|
|
|||
Net Decrease in Net Assets Resulting from Distributions |
|
|
( |
) |
|
|
( |
) |
|
|
( |
) |
|
|
( |
) |
|
|
( |
) |
|
|
|
|
|
|
|
|
|
|
|
|
|
|
|
|
|||||
Net Asset Value, End of Period |
|
$ |
|
|
$ |
|
|
$ |
|
|
$ |
|
|
$ |
|
|||||
|
|
|
|
|
|
|
|
|
|
|
|
|
|
|
|
|||||
Shares Outstanding, End of Period |
|
|
|
|
|
|
|
|
|
|
|
|
|
|
|
|||||
|
|
|
|
|
|
|
|
|
|
|
|
|
|
|
|
|||||
Ratio/Supplemental Data |
|
|
|
|
|
|
|
|
|
|
|
|
|
|
|
|||||
Net assets, end of period |
|
$ |
|
|
$ |
|
|
$ |
|
|
$ |
|
|
$ |
|
|||||
Weighted-average shares outstanding |
|
|
|
|
|
|
|
|
|
|
|
|
|
|
|
|||||
Total Return(3) |
|
|
% |
|
|
% |
|
|
( |
)% |
|
|
% |
|
|
% |
||||
Portfolio turnover |
|
|
% |
|
|
% |
|
|
% |
|
|
% |
|
|
% |
|||||
Ratio of operating expenses to average net assets without waiver(2) |
|
|
% |
|
|
% |
|
|
% |
|
|
% |
|
|
% |
|||||
Ratio of operating expenses to average net assets with waiver(2) |
|
|
% |
|
|
% |
|
|
% |
|
|
% |
|
|
% |
|||||
Ratio of net investment income (loss) to average net assets without waiver(2) |
|
|
% |
|
|
% |
|
|
% |
|
|
% |
|
|
% |
|||||
Ratio of net investment income (loss) to average net assets with waiver(2) |
|
|
% |
|
|
% |
|
|
% |
|
|
% |
|
|
% |
|||||
F-48
Note 13. Selected Quarterly Financial Data (Unaudited)
The following are the quarterly results of operations for the years ended December 31, 2024, 2023, and 2022. The following information reflects all normal recurring adjustments necessary for a fair presentation of the information for the periods presented. The operating results for any quarter are not necessarily indicative of results for any future period.
|
|
For the Three Months Ended |
|
|||||||||||||
|
|
March 31, 2024 |
|
|
June 30, 2024 |
|
|
September 30, 2024 |
|
|
December 31, 2024 |
|
||||
Investment income |
|
$ |
|
|
$ |
|
|
$ |
|
|
$ |
|
||||
Net expenses |
|
|
|
|
|
|
|
|
|
|
|
|
||||
Net investment income (loss) |
|
|
|
|
|
|
|
|
|
|
|
|
||||
Net realized gain (loss) on investments, and foreign currency transactions |
|
|
( |
) |
|
|
( |
) |
|
|
( |
) |
|
|
|
|
Net change in unrealized gain (loss) on investments, foreign currency translations, and foreign currency contracts |
|
|
|
|
|
( |
) |
|
|
( |
) |
|
|
( |
) |
|
Increase (decrease) in net assets resulting from operations |
|
$ |
|
|
$ |
|
|
$ |
|
|
$ |
|
||||
Net asset value per share as of the end of the quarter |
|
$ |
|
|
$ |
|
|
$ |
|
|
$ |
|
||||
|
|
For the Three Months Ended |
|
|||||||||||||
|
|
March 31, 2023 |
|
|
June 30, 2023 |
|
|
September 30, 2023 |
|
|
December 31, 2023 |
|
||||
Investment income |
|
$ |
|
|
$ |
|
|
$ |
|
|
$ |
|
||||
Net expenses |
|
|
|
|
|
|
|
|
|
|
|
|
||||
Net investment income (loss) |
|
|
|
|
|
|
|
|
|
|
|
|
||||
Net realized gain (loss) on investments, and foreign currency transactions |
|
|
( |
) |
|
|
( |
) |
|
|
( |
) |
|
|
( |
) |
Net change in unrealized gain (loss) on investments, foreign currency translations, and foreign currency contracts |
|
|
|
|
|
|
|
|
|
|
|
|
||||
Increase (decrease) in net assets resulting from operations |
|
$ |
|
|
$ |
|
|
$ |
|
|
$ |
|
||||
Net asset value per share as of the end of the quarter |
|
$ |
|
|
$ |
|
|
$ |
|
|
$ |
|
||||
|
|
For the Three Months Ended |
|
|||||||||||||
|
|
March 31, 2022 |
|
|
June 30, 2022 |
|
|
September 30, 2022 |
|
|
December 31, 2022 |
|
||||
Investment income |
|
$ |
|
|
$ |
|
|
$ |
|
|
$ |
|
||||
Net expenses |
|
|
|
|
|
|
|
|
|
|
|
|
||||
Net investment income (loss) |
|
|
|
|
|
|
|
|
|
|
|
|
||||
Net realized gain (loss) on investments, and foreign currency transactions |
|
|
( |
) |
|
|
( |
) |
|
|
( |
) |
|
|
( |
) |
Net change in unrealized gain (loss) on investments, foreign currency translations, and foreign currency contracts |
|
|
( |
) |
|
|
( |
) |
|
|
( |
) |
|
|
( |
) |
Increase (decrease) in net assets resulting from operations |
|
$ |
( |
) |
|
$ |
( |
) |
|
$ |
( |
) |
|
$ |
|
|
Net asset value per share as of the end of the quarter |
|
$ |
|
|
$ |
|
|
$ |
|
|
$ |
|
||||
F-49
Note 14. Subsequent Events
The Company’s management has evaluated subsequent events through the date of issuance of the consolidated financial statements included herein. There have been no subsequent events that require recognition or disclosure in these consolidated financial statements, except for the following:
Distributions
On January 13, 2025, the Company paid a distribution in the amount of $
Unfunded Capital Commitments
On January 8, 2025, $
On January 15, 2025, $
On January 21, 2025, $
On January 31, 2025, $
On January 31, 2025, the outstanding commitment of $
On February 3, 2025, $
On February 10, 2025, $
Company Rule 10b5-1 Stock Repurchase Plan
From January 1, 2025 to February 26, 2025, the Company repurchased
On December 19, 2024, the Company entered into a share repurchase plan (the “Extended Company Rule 10b5-1 Stock Repurchase Plan”) to acquire up to $
The Extended Company Rule 10b5-1 Stock Repurchase Plan is intended to allow the Company to repurchase shares of its common stock at times when it otherwise might be prevented from doing so under insider trading laws. The Extended Company Rule 10b5-1 Stock Repurchase Plan will require the Company’s agent to repurchase shares of the Company’s common stock on the Company’s behalf when the market price per share of the Company’s common stock is below the most recently reported NAV per share of common stock. Under the Extended Company Rule 10b5-1 Stock Repurchase Plan, the agent will increase the volume of purchases made as the price of the Company’s common stock declines, subject to volume restrictions.
F-50
ITEM 9. CHANGES IN AND DISAGREEMENTS WITH ACCOUNTANTS ON ACCOUNTING AND FINANCIAL DISCLOSURE
Not Applicable.
ITEM 9A. CONTROLS AND PROCEDURES
Evaluation of Disclosure Controls and Procedures
Our management, with the participation of our Chief Executive Officer and Chief Financial Officer, has evaluated the effectiveness of our disclosure controls and procedures (as defined in Rules 13a-15(e) and 15d-15(e) under the Securities Exchange Act of 1934, as amended), as of the end of the period covered by this Annual Report on Form 10-K. Based on such evaluation, our Chief Executive Officer and Chief Financial Officer have concluded that, as of such date, our disclosure controls and procedures were effective at a reasonable assurance level.
Internal Control Over Financial Reporting
Our management, including our Chief Executive Officer and Chief Financial Officer, is responsible for establishing and maintaining adequate internal control over financial reporting, as such term is defined in Rules 13a-15(f) and 15d-15(f) under the Exchange Act. Our internal control over financial reporting is a process designed to provide reasonable assurance regarding the reliability of financial reporting and the preparation of our financial statements for external reporting purposes in accordance with GAAP. Internal control over financial reporting includes those policies and procedures that: (i) pertain to the maintenance of records that in reasonable detail accurately and fairly reflect the transactions and dispositions of the assets of the company; (ii) provide reasonable assurance that transactions are recorded as necessary to permit preparation of financial statements in accordance with GAAP, and that receipts and expenditures of the company are being made only in accordance with authorizations of management and directors of the company; and (iii) provide reasonable assurance regarding prevention or timely detection of unauthorized acquisition, use, or disposition of the company’s assets that could have a material effect on the financial statements. Because of its inherent limitations, internal control over financial reporting may not prevent or detect misstatements. Also, projections of any evaluation of effectiveness to future periods are subject to the risk that controls may become inadequate because of changes in conditions, or that the degree of compliance with policies or procedures may deteriorate.
Management (with the participation of our Chief Executive Officer and Chief Financial Officer) conducted an evaluation of the effectiveness of our internal control over financial reporting based on the framework in Internal Control — Integrated Framework issued in 2013 by the Committee of Sponsoring Organizations of the Treadway Commission. Based on this evaluation, management concluded that our internal control over financial reporting was effective as of December 31, 2024.
Changes in Internal Control over Financial Reporting
There have been no changes in our internal control over financial reporting during our fiscal quarter ended December 31, 2024 that have materially affected, or are reasonably likely to materially affect, our internal control over financial reporting.
56
ITEM 9B. OTHER INFORMATION
Fees and Expenses
The following table is intended to assist you in understanding the fees and expenses that an investor in our common stock will bear directly or indirectly. We caution you that some of the percentages indicated in the table below are estimates and may vary. The following table should not be considered a representation of our future expenses. Actual expenses may be greater or less than shown. Except where the context suggests otherwise, whenever this prospectus supplement contains a reference to fees or expenses paid by “us” or that “we” will pay fees or expenses, our stockholders will indirectly bear such fees or expenses as our investors.
Stockholder transaction expenses (as a percentage of offering price): |
|
|
|
|
|
|
|
|
|
Sales load |
|
|
— % |
(1) |
Offering expenses |
|
|
— % |
(2) |
Dividend reinvestment plan expenses |
|
|
None |
(3) |
|
|
|
|
|
Total stockholder transaction expenses |
|
|
— % |
|
Estimated annual expenses (as a percentage of net assets attributable to common stock): |
|
|
|
|
Base management fee |
|
|
1.75% |
(4) |
Incentive fee payable under the Advisory Agreement (12.5% of net investment income) |
|
|
1.56% |
(5) |
Interest payments on borrowed funds |
|
|
10.22% |
(6) |
Other expenses |
|
|
1.00% |
(7) |
|
|
|
|
|
Total annual expenses (estimated) |
|
|
14.54% |
|
Example
The following example demonstrates the projected dollar amount of total cumulative expenses that would be incurred over various periods with respect to a hypothetical investment in our common stock. In calculating the following expense amounts, we have assumed we would have no additional leverage and that our annual operating expenses would remain at the levels set forth in the table above.
|
|
1 Year |
|
3 Years |
|
5 Years |
|
10 Years |
||||
You would pay the following expenses on a $1,000 investment, assuming a 5% annual return |
|
$130 |
|
|
$359 |
|
|
$553 |
|
|
$918 |
|
While the example assumes, as required by the SEC, a 5% annual return, our performance will vary and may result in a return greater or less than 5%. The incentive fee under the Advisory Agreement is not included in the example due to the uncertainty regarding whether or not the incentive fee would be payable given that it is dependent on the Company’s future performance. If we achieve sufficient returns on our investments to trigger an incentive fee of a material amount, our expenses, and returns to our investors, would be higher. The example assumes reinvestment of all distributions at NAV. In addition, while the example assumes reinvestment of all dividends and distributions at NAV, under certain circumstances, reinvestment of dividends and other distributions under our dividend reinvestment plan may occur at a price per share that differs from NAV. See “Management’s Discussion and Analysis of Financial Condition and Results of Operations—Distribution Policy” included in Item 7 of Part II of this Annual Report for additional information regarding our dividend reinvestment plan.
This example and the expenses in the table above should not be considered a representation of our future expenses, and actual expenses (including the cost of debt, if any, and other expenses) may be greater or less than those shown.
ITEM 9C. DISCLOSURE REGARDING FOREIGN JURISDICTIONS THAT PREVENT INSPECTIONS
None.
57
PART III
ITEM 10. DIRECTORS, EXECUTIVE OFFICERS AND CORPORATE GOVERNANCE
Management
Our Board oversees our management. Our Board currently consists of five members, three of whom are not “interested persons” as defined in Section 2(a)(19) of the 1940 Act. Our Board elects our officers, who serve at the discretion of our Board until the next election of officers or until his or her successor is duly elected and qualifies, or until his or her death, resignation, retirement, disqualification or removal. The responsibilities of our Board include the quarterly valuation of our assets and the oversight of our investment activity, corporate governance activities and financing arrangements. Oversight of our investment activities extends to oversight of the risk management processes employed by our Investment Advisor as part of its day-to-day management of our investment activities. Our Board reviews risk management processes at both regular and special board meetings throughout the year, consulting with appropriate representatives of our Investment Advisor as necessary and periodically requesting the production of risk management reports or presentations. The goal of our Board’s risk oversight function is to ensure that the risks associated with our investment activities are accurately identified, thoroughly investigated and responsibly addressed. However, our Board’s oversight function cannot eliminate all risks or ensure that particular events do not adversely affect the value of investments.
Our Board has also established an Audit Committee, a Nominating and Corporate Governance Committee and a Compensation Committee, and may establish additional committees in the future.
Board of Directors and Officers
Our Board is presently composed of five directors. Under our charter and bylaws, our directors are divided into three classes. At each annual meeting, directors are elected for a term expiring at the third succeeding annual meeting, with the term of office of only one of these three classes of directors expiring each year. Each director will hold office for the term to which he or she is elected and until his or her successor is duly elected and qualifies, or until his or her death, resignation, retirement, disqualification or removal.
Directors
Name, Address and Age (1) |
|
Position(s) |
|
Term of Office and |
|
Principal Occupation(s) |
|
Other Public |
Independent Director |
|
|
|
|
|
|
|
|
Christopher C. Nelson – 50 |
|
Director |
|
Class II Director since November 2019; Term Expires 2026 |
|
Wealth Advisor at SeaCrest Wealth Management, a financial advisory firm, since May 2018. Vice President at Enterprise Trust Company, an investment management firm, from February 2013 to February 2018. |
|
Member of the Board of Trustees of Palmer Square Opportunistic Income Fund since February 2024 and Palmer Square Funds Trust since March 2024. |
Megan L. Webber – 50 |
|
Director |
|
Class I Director since November- 2019; Term Expires 2025 |
|
Director of Investment Reporting at The Anschutz Corporation, a private holding company. |
|
Member of the Board of Trustees of Palmer Square Opportunistic Income Fund since August 2014 and Palmer Square Funds Trust since March 2024. |
James W. Neville Jr. – 60 |
|
Director |
|
Class III Director since November 2019; Term Expires 2027 |
|
Proprietary trader and investor. Portfolio Manager at Great Plains Principal Trading, an asset management firm, from January 2012 through June 2019. |
|
Member of the Board of Trustees of Palmer Square Opportunistic Income Fund since August 2014 and Palmer Square Funds Trust since March 2024. |
Interested Director |
|
|
|
|
|
|
|
|
Christopher D. Long – 49 |
|
Chief Executive Officer and Chairman |
|
Class I Director since November 2019; Term Expires 2025 |
|
Chief Executive Officer of Palmer Square Capital Management LLC. |
|
Member of the Board of Trustees of Palmer Square Opportunistic Income Fund from August 2014 to October 2018. |
Jeffrey D. Fox – 49 |
|
Chief Financial Officer and Director |
|
Class III Director since November 2019; Term Expires 2027 |
|
President of Palmer Square Capital Management LLC since March 2020. Managing Director of Palmer Square Capital Management LLC from April 2013 to March 2020. |
|
None |
58
Executive Officers Who Are Not Directors
Information regarding our executive officers who do not serve on the Board is as follows:
Name, Address and Age(1) |
|
Positions |
|
Principal Occupation(s) During the Past 5 Years |
Angie K. Long – 50 |
|
Chief Investment Officer |
|
Ms. Long was appointed as our Chief Investment Officer in 2019. Ms. Long also serves as Chief Investment Officer of PSCM and has key responsibilities for all investment-related activities at PSCM. Prior to joining PSCM in 2011, Ms. Long worked for JPMorgan Chase & Co. in New York for 13 years. Ms. Long held many senior roles including Deputy Head of North American Credit Trading, Head of High Yield Trading, and Head of Credit Derivatives Trading. Ms. Long has been a trader of many products including high yield bonds, high yield credit derivatives, distressed debt, capital structure arbitrage, and structured credit. In addition, she worked with the Global Head of Credit Trading to help oversee risk management for the High Yield and High Grade credit trading books. Ms. Long is married to Christopher D. Long, our Chairman and Chief Executive Officer. Ms. Long received an AB degree in Economics from Princeton University and is also a CFA® charterholder. |
|
|
|
|
|
Matthew L. Bloomfield – 44 |
|
President |
|
Mr. Bloomfield was appointed as our President in 2022. Mr. Bloomfield is the Portfolio Manager for PSCM’s US CLO management platform and has key responsibilities for all of PSCM’s leveraged loan product offerings and risk management. He is a member of both the US and European CLO investment committees, as well as a member of the Company’s Investment Committee. Prior to joining PSCM in 2015, Mr. Bloomfield worked at Golub Capital in Chicago, most recently as an Associate Portfolio Manager within the Broadly Syndicated Loan Group where he focused on investing in leveraged loans via CLOs and separately managed accounts. Prior to joining Golub Capital, Mr. Bloomfield worked at Giuliani Capital Advisors in Chicago as an Analyst and subsequently Associate in the Investment Banking Group where he focused on special situations and restructuring mandates. Mr. Bloomfield earned an MBA in Finance from Northwestern University’s Kellogg School of Management, as well as a BS and BGS in Business Administration and Economics, respectively, from the University of Kansas. |
|
|
|
|
|
Scott A. Betz – 47 |
|
Chief Compliance Officer |
|
Mr. Betz was appointed as our Chief Compliance Officer in 2019. Mr. Betz also serves as Chief Operating Officer of PSCM and previously served as Chief Compliance Officer of PSCM from March 2018 to March 2021. Prior to joining PSCM in March 2018, Mr. Betz worked for over 14 years at Scout Investments, most recently as Chief Operating Officer, Chief Compliance Officer and Treasurer. Prior to joining Scout Investments, Mr. Betz worked for over six years at UMB Bank as a Performance Measurement Specialist and subsequently as Investment Technology Officer. Mr. Betz received an MBA degree and a BA degree in Political Science from the University of Missouri-Kansas City. |
Information About Each Director’s Experience, Qualifications, Attributes or Skills
The Board believes that, collectively, the directors have balanced and diverse experience, qualifications, attributes and skills, which allow the Board to operate effectively in governing the Company and protecting the interests of its stockholders. Below is a description of the various experiences, qualifications, attributes and/or skills with respect to each director considered by the Board.
59
Interested Directors
Christopher D. Long
Mr. Long was appointed as our Chairman and Chief Executive Officer in 2019 and has served on our Board since November 2019. Mr. Long has also served as Chief Executive Officer of our Investment Advisor since 2019 and Chief Executive Officer of PSCM since 2009 and is responsible for managing our Investment Advisor’s and PSCM’s overall business. Mr. Long also served as our President from November 2019 to March 2022 and as President of PSCM from 2009 to March 2020. Since PSCM’s inception, Mr. Long has been successful in not only building a highly-experienced investment team, but also an integrated credit investment platform that manages mutual fund offerings, private funds and separately managed accounts. PSCM has a client list that spans not only institutions and family offices, but also registered investment advisers, banks/trusts, and broker-dealers. Mr. Long’s previous work experience includes key investment roles at Prairie Capital and Sandell Asset Management as well as working at Morgan Stanley in the Credit Derivatives and Distressed Securities Group focused on the firm’s proprietary investments. Before Morgan Stanley, he worked at TH Lee Putnam Ventures, a private equity fund sponsored by Thomas H Lee Partners and Putnam Investments. In that role, he also served on the Board of Directors of Avero, Inc. and was a Board Observer for Parago, Inc. He started his career at JPMorgan & Co. in Leveraged Finance and Mergers & Acquisitions (FIG Group) advising corporations and private equity firms on investment banking and capital markets. Mr. Long previously served on the board of trustees of Palmer Square Opportunistic Income Fund (Nasdaq) from August 2014 to October 2018. Mr. Long is married to Angie K. Long, our Chief Investment Officer. He received an MBA degree from the Harvard Business School and an AB degree in Economics cum laude from Princeton University. The Board believes that Mr. Long’s strong investment and operating leadership experience qualifies him to serve on the Board.
Jeffrey D. Fox
Mr. Fox was appointed as our Chief Financial Officer in 2019 and has served on our Board since November 2019. Mr. Fox has also served as Chief Financial Officer of our Investment Advisor since 2019 and as President of PSCM since March 2020. Mr. Fox previously served as our Treasurer from November 2019 to March 2022 and as Managing Director of PSCM from April 2013 to March 2020. Prior to joining PSCM in April 2013, Mr. Fox worked for Sandler O’Neill and Partners from September 2011 to March 2013 where he was a Managing Director within Fixed Income where he was involved in the structuring and sales of many products, including CLOs. Before Sandler O’Neill, Mr. Fox worked for Société Générale as a Director within Global Markets Advisory where he was instrumental in the US CDO/CLO and RMBS Credit Advisory effort. His work included the restructuring of various structured credit legacy positions for European institutions as well as the modeling behind the corporate rating and pricing for various structured products. Prior to Société Générale, Mr. Fox was employed by JPMorgan Chase & Co/Bear Stearns, where he was an Associate Director in the FAST organization focusing on the structuring of Trust Preferred CDOs and CLOs. Also, while at Bear Stearns, Mr. Fox managed the global CDO analytics desk which included intensive credit modeling of various asset classes. Mr. Fox received a MS degree in Computer Information Systems from Arizona State University and a BS degree in Geology with a minor in Mathematics from Northern Arizona University. The Board believes that Mr. Fox’s strong operational and financial experience qualifies him to serve on the Board.
Independent Directors
Megan L. Webber
Ms. Webber has served on our Board since November 2019. Ms. Webber is a Director of Investment Reporting at The Anschutz Corporation, where she has worked for over 23 years. Prior to Anschutz Corporation, she was a Supervising Audit Senior at KPMG, LLP from 1997 to 2000. Ms. Webber has served on the board of trustees of Palmer Square Opportunistic Income Fund (Nasdaq) since 2014, and previously served on the board of trustees of Montage Managers Trust from July 2015 to March 2017. Ms. Webber received a BS in Accounting from Indiana University and received her CPA license in 1997. The Board believes that Ms. Webber’s strong financial and audit experience qualifies her to serve on the Board.
James W. Neville Jr.
Mr. Neville has served on our Board since November 2019. Mr. Neville is an active proprietary trader and investor. He was a Portfolio Manager at Great Plains Principal Trading from January 2012 through June 2019. Prior to Great Plains Principal Trading, Mr. Neville served as a proprietary trader for over 23 years, focusing on agriculture futures and options as well as stock index futures and energy. Mr. Neville has served on the board of directors of Palmer Square Opportunistic Income Fund (Nasdaq) since 2014. The Board believes that Mr. Neville’s strong investment management and trading experience qualifies him to serve on the Board.
Christopher C. Nelson
Mr. Nelson has served on our Board since November 2019. Mr. Nelson is a Wealth Advisor at SeaCrest Wealth Management, where he has worked since May 2018. Prior to SeaCrest Wealth Management, Mr. Nelson was a Vice President at Enterprise Trust Company from February 2013 to February 2018, where he led the Kansas City team. Prior to that, Mr. Nelson held investment management roles at The Private Bank, Kornitzer Capital Management, and The Bank of New York. Mr. Nelson received a Bachelor of Arts in English from Gettysburg College in Gettysburg, Pennsylvania. The Board believes that Mr. Nelson’s strong investment management experience qualifies him to serve on the Board.
Committees of the Board of Directors
An Audit Committee, a Nominating and Corporate Governance Committee and a Compensation Committee have been established by our Board.
60
Audit Committee
The members of our Audit Committee are Megan L. Webber, James W. Neville Jr. and Christopher C. Nelson, each of whom meets the independence standards established by the SEC for audit committees and is independent for purposes of the 1940 Act. Ms. Webber serves as Chair of our Audit Committee. Our Board has determined that Ms. Webber is an “audit committee financial expert” under SEC rules. Our Audit Committee’s responsibilities include selecting our independent registered public accounting firm; reviewing with such independent registered public accounting firm the planning, scope and results of their audit of our financial statements; pre-approving the fees for services performed; reviewing, in consultation with the independent registered public accounting firm, the adequacy of internal control systems; reviewing our annual financial statements; overseeing internal audit staff, if any, and periodic filings; and receiving our audit reports and financial statements.
Nominating and Corporate Governance Committee
The members of the Nominating and Corporate Governance Committee are Megan L. Webber, James W. Neville and Christopher C. Nelson, each of whom is an independent director. Mr. Nelson serves as Chairman of the Nominating and Corporate Governance Committee. The Nominating and Corporate Governance Committee operates pursuant to a charter approved by our Board. The Nominating and Corporate Governance Committee is responsible for selecting, researching and nominating qualified nominees to be elected to the Board by our stockholders at the annual stockholder meeting, selecting qualified nominees to fill any vacancies on our Board or a committee of our Board (consistent with criteria approved by our board of directors), developing and recommending to our Board a set of corporate governance principles applicable to us and overseeing the evaluation of our Board and our management.
Compensation Committee
The members of our Compensation Committee are Megan L. Webber, James W. Neville and Christopher C. Nelson, each of whom is an independent director. Mr. Neville serves as Chairman of the Compensation Committee. The Compensation Committee is responsible for determining, or recommending to the Board for determination, the compensation, if any, of our chief executive officer and all other executive officers. The Compensation Committee also assists the Board with matters related to compensation generally, except with respect to compensation of the directors. It is the responsibility of the independent directors to review their own compensation and recommend to all of the directors the appropriate level of compensation. As none of our executive officers currently is compensated by us, the Compensation Committee does not produce and/or review a report on executive compensation practices.
Section 16(a) Beneficial Ownership Reporting Compliance
Section 16(a) of the Exchange Act requires the Company’s officers and directors, and persons who own more than 10% of our Common Stock, to file reports of securities ownership and changes in such ownership with the SEC. Officers, directors, and greater than 10% stockholders also are required by SEC rules to furnish the Company with copies of all Section 16(a) forms they file.
Based solely on the Company’s review of Forms 3, 4 and 5 filed by such persons and information provided by the Company’s directors and officers, the Company believes that during the year ended December 31, 2024, all Section 16(a) filing requirements applicable to such persons were met in a timely manner.
Code of Conduct, Code of Ethics and Insider Trading Policy
We expect each of our officers and directors, as well as any person affiliated with our operations, to act in accordance with the highest standards of personal and professional integrity at all times and to comply with the Company’s policies and procedures and all laws, rules and regulations of any applicable international, federal, provincial, state or local government. To this effect, the Board has adopted a Code of Ethics. The Code of Ethics applies to all of the Company’s directors and officers. The Company's insider trading policies are included in the Company's Code of Ethics.
As required by the 1940 Act and the Advisers Act, we and our Investment Advisor have each adopted a Code of Ethics that establishes procedures that apply to our directors, executive officers, officers, their respective staffs and the employees of our Investment Advisor with respect to their personal investments and investment transactions. Our Code of Ethics generally does not permit investments by our directors, officers or any other covered person in securities that may be purchased or held by us.
Nomination of Directors
There have been no material changes to the procedures by which stockholders may recommend nominees to our Board since the filing of our Proxy Statement for our 2024 Annual Meeting of Stockholders.
ITEM 11. EXECUTIVE COMPENSATION
None of our officers receives direct compensation from us. However, Messrs. Betz, Long, Fox and Bloomfield and Ms. Long, through their indirect financial interests in our Investment Advisor, have an indirect pecuniary interest in the investment advisory fees paid by us under the Advisory Agreement. In addition, the Company is responsible for expenses incurred by the Administrator in connection with administering the Company’s business, including making payments to the Administrator based upon the Company’s allocable portion of the Administrator’s overhead and other expenses associated with performing its obligations under the Administration Agreement, including rent, the fees and expenses associated with performing compliance functions and the allocable portion of the costs of compensation and related expenses of the Company’s Chief Compliance Officer and Chief Financial Officer and their respective administrative support staffs.
61
Compensation of Directors
The Independent Directors receive an annual fee of $50,000. They also receive reimbursement of reasonable out-of-pocket expenses incurred in connection with attending each regular Board meeting, each special meeting and each committee meeting attended. We have obtained directors’ and officers’ liability insurance on behalf of our directors and officers. No compensation is paid to directors who are “interested persons.” The Board reviews and determines the compensation of Independent Directors.
The following table shows information regarding the compensation earned by our directors for the year ended December 31, 2024. No compensation is paid by us to any interested director or executive officer of the Company.
Name |
|
Aggregate |
|
|
Pension or |
|
|
Total |
|
|||
Independent Directors |
|
|
|
|
|
|
|
|
|
|||
Megan L. Webber |
|
$ |
50,000 |
|
|
|
- |
|
|
$ |
50,000 |
|
James W. Neville Jr. |
|
$ |
50,000 |
|
|
|
- |
|
|
$ |
50,000 |
|
Christopher C. Nelson |
|
$ |
50,000 |
|
|
|
- |
|
|
$ |
50,000 |
|
Interested Directors |
|
|
|
|
|
|
|
|
|
|||
Christopher D. Long |
|
$ |
- |
|
|
|
- |
|
|
$ |
- |
|
Jeffrey D. Fox |
|
$ |
- |
|
|
|
- |
|
|
$ |
- |
|
ITEM 12. SECURITY OWNERSHIP OF CERTAIN BENEFICIAL OWNERS AND MANAGEMENT AND RELATED STOCKHOLDER MATTERS
The following table shows information as of February 26, 2025, unless otherwise indicated, regarding the beneficial ownership of our Common Stock by: (i) each person known to the Company to beneficially own more than 5% of the outstanding shares of Common Stock; (ii) each director of the Company; (iii) each executive officer of the Company; and (iv) all directors and executive officers as a group. With respect to persons known to the Company to beneficially own more than 5% of the outstanding shares of Common Stock, the Company bases such knowledge on beneficial ownership filings made by the holders with the SEC and other information known to the Company.
The percentage ownership is based on 32,611,553 shares of our Common Stock issued and outstanding as of February 26, 2025. Unless otherwise indicated, all persons named as beneficial owners of our Common Stock have sole voting power and sole investment power with respect to the shares indicated as beneficially owned. None of the shares of Common Stock beneficially owned by our officers or directors has been pledged as security for an obligation. In addition, unless otherwise indicated, the address for each person named below is c/o Palmer Square Capital BDC Inc., Attention: Secretary, 1900 Shawnee Mission Parkway, Suite 315, Mission Woods, Kansas 66205.
Name and Address |
|
Shares |
|
|
|
Percentage of |
|
||
Christopher D. Long |
|
102, 137 |
|
(3) |
|
* |
|
||
Jeffrey D. Fox |
|
|
12,345 |
|
|
|
* |
|
|
Megan L. Webber |
|
|
- |
|
|
|
|
- |
|
James W. Neville Jr. |
|
|
- |
|
|
|
|
- |
|
Christopher C. Nelson |
|
|
- |
|
|
|
|
- |
|
Angie K. Long |
|
|
102,137 |
|
(3) |
|
* |
|
|
Scott A. Betz |
|
|
6,284 |
|
|
|
* |
|
|
Matthew L. Bloomfield |
|
|
106,729 |
|
|
|
* |
|
|
All directors and executive officers as a group (8 persons) |
|
|
227,495 |
|
|
|
* |
|
|
Excelsior Holdings D2 LLC (4) |
|
|
3,730,065 |
|
|
|
|
11.44 |
% |
Alaris Master Fund, LP (5) |
|
|
3,707,377 |
|
|
|
|
11.37 |
% |
Caravel Holdings LLC (6) |
|
|
3,983,290 |
|
|
|
|
12.21 |
% |
Martin C. Bicknell (7) |
|
|
2,954,714 |
|
|
|
|
9.06 |
% |
First Trust Capital Management L.P. (8) |
|
|
2,122,165 |
|
|
|
|
6.51 |
% |
* Represents less than 1.0% of the issued and outstanding shares of our Common Stock as of the Record Date.
62
Transactions with Related Persons
Investment Advisory Agreement
We have entered into the Advisory Agreement with our Investment Advisor pursuant to which we pay the Investment Advisor a base management fee and incentive fee (which incentive fee is only payable following the completion of the IPO) in exchange for the Investment Advisor’s services sourcing, reviewing and structuring investment opportunities for us, underwriting and performing diligence on our investments and monitoring our investment portfolio on an ongoing basis. Our Board initially approved the Advisory Agreement at an in-person meeting in November 2019, and the Company entered into the Advisory Agreement in January 2020. Unless terminated earlier as described below, the Advisory Agreement will remain in effect from year to year if approved annually by our Board or by the affirmative vote of the holders of a majority of our outstanding voting securities, and, in either case, if also approved by a majority of our Independent Directors. At a meeting held on March 10, 2022, our Board approved an amended and restated Advisory Agreement, to be effective upon completion of the IPO. Our Board most recently determined to re-approve the Advisory Agreement for an additional one-year term ending January 13, 2026 at a meeting held on November 1, 2024. Messrs. Long, Fox, Bloomfield and Betz and Ms. Long, through their indirect financial interests in our Investment Advisor, have an indirect pecuniary interest in the investment advisory fees paid by us under the Advisory Agreement. Under the incentive fee structure, our adjusted net investment income for purposes thereof will be computed and paid on income that may include interest income that has been accrued but not yet received in cash. This fee structure may give rise to a conflict of interest for our Investment Advisor to the extent that it encourages the Investment Advisor to favor debt financings that provide for deferred interest, rather than current cash payments of interest. Additionally, in the Investment Advisor’s capacity as our valuation designee pursuant to Rule 2a-5 under the 1940 Act, we rely on investment professionals from the Investment Advisor in connection with the valuation of our portfolio investments. While the valuation for each portfolio investment that constitutes a material portion of our portfolio and that does not have a readily available market quotation will be reviewed by an independent valuation firm at least once annually, the ultimate determination of fair value will be made by our Investment Advisor (subject to the Board’s oversight) and not by such third-party valuation firm. The participation of the Investment Advisor’s investment professionals in our valuation process could result in a conflict of interest as the Investment Advisor’s management fee is based, in part, on the value of our total net assets. For the year ended December 31, 2024, the Investment Advisor earned a base management fee of $9.7 million, offset by $(50.5) thousand in management fee waiver from the Investment Advisor, and earned an incentive fee of $8.6 million.
Administration Agreement
We have entered into the Administration Agreement with the Administrator pursuant to which the Administrator furnishes us with office facilities and equipment and provides us with clerical, bookkeeping, recordkeeping and other administrative services. Our Board approved the Administration Agreement in November 2019, and the Company entered into the Administration Agreement in January 2020. Our Board most recently determined to re-approve the Administration Agreement for an additional one-year term ending January 13, 2026 at a meeting held on November 1, 2024. Under the Administration Agreement, the Administrator performs, or oversees the performance of, our required administrative services, which include, among other things, being responsible for the financial records which we are required to maintain and preparing reports to our stockholders and reports filed with the SEC.
63
Resource Sharing Agreement
The Investment Advisor is an affiliate of PSCM, with whom it has entered into a resource sharing agreement (the “Resource Sharing Agreement”). Under this agreement, PSCM provides the Investment Advisor experienced investment professionals and access to the senior investment personnel and other resources of PSCM and its affiliates. The Resource Sharing Agreement provides the Investment Advisor with access to deal flow generated by the professionals of PSCM and its affiliates and commits the members of the Investment Advisor’s investment committee to serve in that capacity. The Investment Advisor seeks to capitalize on what we believe to be the significant deal origination, credit underwriting, due diligence, investment structuring, execution, portfolio management and monitoring experience of PSCM’s investment professionals. The Resource Sharing Agreement may be terminated by either party on 60 days’ notice.
License Agreement
We have also entered into a license agreement (the “License Agreement”) with PSCM under which PSCM has granted us a non-exclusive, royalty-free license to use the name “Palmer Square” for specified purposes in our business. Under the License Agreement, we have a right to use the “Palmer Square” name, subject to certain conditions, for so long as our Investment Advisor or one of its affiliates remains our investment adviser. Other than with respect to this limited license, we will have no legal right to the “Palmer Square” name.
Policies and Procedures for Managing Conflicts; Co-investment Opportunities
We have procedures in place for the review, approval and monitoring of transactions involving the Company and certain persons related to the Company. As a BDC, the 1940 Act restricts us from participating in certain transactions with certain persons affiliated with the Company, including our officers, directors, and employees and any person controlling or under common control with us. In addition, each of our directors and executive officers is required to complete questionnaire on an annual basis designed to elicit information about any potential related-party transactions. In order to ensure that we do not engage in any prohibited transactions with any persons affiliated with the Company, our officers screen each of our transactions for any possible affiliations, close or remote, between the proposed portfolio investment, the Company, companies controlled by us and our employees and directors. We will not enter into any transactions unless and until we are satisfied that the transaction is not prohibited by the 1940 Act or, if such prohibitions exist, we have taken appropriate actions to seek Board review and approval or exemptive relief from the SEC for such transaction.
The Investment Advisor, PSCM, and their affiliates, partners and employees (collectively, “PSCM Affiliates”) may engage in any other business and furnish investment management and advisory services and other types of services to others which may include, without limitation, serving as investment manager or sponsor of other collective investment vehicles or managed accounts that acquire interests in, provide financing to or otherwise deal in securities or other investments that would be suitable investments for us. PSCM Affiliates furnish investment management or advisory services to other persons with investment policies similar or different to those of us. Such persons may own securities or other instruments of the same class or type or which may be senior to those held by us, and they have incentives, financial or otherwise, to favor certain accounts or vehicles over others. There is no assurance that accounts with similar strategies or investment objectives will hold the same investments or perform in a similar manner. This and other future activities of PSCM Affiliates may give rise to additional conflicts of interest.
Subject to certain 1940 Act restrictions on co-investments with affiliates or in accordance with the conditions of the co-investment exemptive relief provided by the SEC (as discussed below), the Investment Advisor offers us the right to participate in all investment opportunities that it determines are appropriate for us in view of our investment objective, positions, policies, strategies and restrictions as well as regulatory requirements and other relevant factors. Such offers are subject to the exception that, in accordance with the Investment Advisor’s code of ethics and allocation policies, we might not participate in each individual opportunity but, on an overall basis, the Investment Advisor will seek to allocate investments across applicable client accounts in a manner that is fair and equitable on an overall basis.
We, the Investment Advisor and PSCM have been granted exemptive relief from the SEC to permit greater flexibility to negotiate the terms of co-investments if our Board determines that it would be advantageous for us to co-invest with investment funds, accounts and investment vehicles managed by PSCM in a manner consistent with our investment objectives, positions, policies, strategies and restrictions as well as regulatory requirements and other pertinent factors. We believe that co-investment by us and investment funds, accounts and investment vehicles managed by the Investment Advisor and its affiliates, including PSCM, may afford us additional investment opportunities and an ability to achieve greater diversification. Accordingly, our exemptive order permits us to invest with these investment funds, accounts and investment vehicles managed in the same portfolio companies under circumstances in which such investments would otherwise not be permitted by the 1940 Act. Our exemptive relief permitting co-investments applies only if our independent directors review and approve each co-investment. The exemptive relief imposes other constraints on co-investments that limit the number of instances when the Company may rely on its protections.
The Investment Advisor and its affiliates have both subjective and objective policies and procedures in place that are designed to manage the potential conflicts of interest between the Investment Advisor’s fiduciary obligations to us and its similar fiduciary obligations to other clients. To the extent that we compete with entities sponsored or managed by the Investment Advisor or its affiliates for a particular investment opportunity, the Investment Advisor will allocate investment opportunities across the entities for which such opportunities are appropriate, consistent with (1) its internal conflict of interest and allocation policies, (2) the requirements of the Advisers Act, and (3) certain restrictions under the 1940 Act regarding co-investments with affiliates. The Investment Advisor’s allocation policies are intended to ensure that, over time, we may generally share equitably with other accounts sponsored or managed by the Investment Advisor or its affiliates in investment opportunities, particularly those involving a security with limited supply or involving differing classes of securities of the same issuer which may be suitable for us and such other accounts. There can be no assurance that the Investment Advisor’s or its affiliates’ efforts to allocate any particular investment opportunity fairly among all clients for whom such opportunity is appropriate will result in an allocation of all or part of such opportunity to us. Not all conflicts of interest can be expected to be resolved in our favor.
64
Director Independence
The 1940 Act requires that at least a majority of the Company’s directors not be “interested persons” (as defined in the 1940 Act) of the Company. On an annual basis, each member of our Board is required to complete an independence questionnaire designed to provide information to assist the Board in determining whether the director is independent under the 1940 Act and our corporate governance guidelines. Our Board has determined that each of our directors, other than Mr. Christopher D. Long and Mr. Jeffrey D. Fox, is independent under the 1940 Act. Our governance guidelines require any director who has previously been determined to be independent to inform the Chairman of the Board and our Secretary of any change in circumstance that may cause his or her status as an Independent Director to change. The Board limits membership on the Audit Committee, Nominating and Corporate Governance Committee and Compensation Committee to Independent Directors.
ITEM 14. PRINCIPAL ACCOUNTANT FEES AND SERVICES
The following aggregate fees by PricewaterhouseCoopers LLP (“PwC”), the Company’s independent registered accounting firm for the fiscal years ended December 31, 2024, 2023, and 2022, were billed to the Company for work attributable to audit, tax and other services provided to the Company for such fiscal year.
|
|
Fiscal Year |
|
|
Fiscal Year |
|
|
Fiscal Year |
|
|||
|
|
December 31, |
|
|
December 31, |
|
|
December 31, |
|
|||
Audit Fees |
|
$ |
479,069 |
|
|
$ |
364,574 |
|
|
$ |
343,010 |
|
Audit-Related Fees |
|
|
45,000 |
|
|
|
45,000 |
|
|
|
45,000 |
|
Tax Fees |
|
|
51,550 |
|
|
|
44,000 |
|
|
|
42,000 |
|
All Other Fees |
|
|
2,000 |
|
|
|
2,000 |
|
|
|
900 |
|
Total |
|
$ |
577,619 |
|
|
$ |
455,574 |
|
|
$ |
430,910 |
|
Audit Fees
Audit fees consist of fees billed for professional services rendered for the audit of our year-end financial statements and services that were provided by PwC for the fiscal years ended December 31, 2024, 2023, and 2022 in connection with statutory and regulatory filings.
Audit-Related Fees
Audit-related services consist of fees billed for assurance and related services that are reasonably related to the performance of the audit or review of our financial statements and are not reported under “Audit Fees.” These services include attest services that are not required by statute or regulation and consultations concerning financial accounting and reporting standards.
Tax Fees
Tax fees consist of fees billed for professional services for tax compliance and filings. These services include assistance regarding federal, state, and local tax compliance and filings.
All Other Fees
Other fees would include fees billed for products and services other than the services reported above.
The Audit Committee has established a pre-approval policy that describes the permitted audit, audit-related, tax and other services to be provided by PwC, the Company’s independent auditor. The policy requires that the Audit Committee pre-approve the audit and permissible non-audit services performed by the independent auditor in order to assure that the provision of such service does not impair the auditor’s independence.
Any requests for audit, audit-related, tax and other services that have not received general pre-approval must be submitted to the Audit Committee for specific pre-approval, and cannot commence until such approval has been granted. Normally, pre-approval is provided at regularly scheduled meetings of the Audit Committee. However, the Audit Committee may delegate pre-approval authority to one or more of its members. The member or members to whom such authority is delegated must report any pre-approval decisions to the Audit Committee at its next scheduled meeting. The Audit Committee does not delegate its responsibilities to pre-approve services performed by the independent auditor to management.
65
PART IV
ITEM 15. EXHIBITS AND FINANCIAL STATEMENT SCHEDULES
(a) DOCUMENTS FILED AS PART OF THIS REPORT
The following is a list of our consolidated financial statements included in this Annual Report on Form 10-K under Item 8 of Part II hereof:
1. CONSOLIDATED FINANCIAL STATEMENTS AND SUPPLEMENTAL DATA
Index to Consolidated Financial Statements
(b) EXHIBITS
3.1 |
|
|
3.2 |
|
|
3.3 |
|
|
4.1 |
|
|
10.1 |
|
|
10.2 |
|
|
10.3 |
|
|
10.4 |
|
|
10.5 |
|
|
10.6 |
|
|
10.7 |
|
|
10.8 |
|
|
10.9 |
|
|
10.10 |
|
|
10.11 |
|
|
10.12 |
|
|
10.13 |
|
|
10.14 |
|
|
10.15 |
|
66
10.16 |
|
|
10.17 |
|
|
10.18 |
|
|
10.19 |
|
|
10.20 |
|
|
10.21 |
|
|
10.22 |
|
|
10.23 |
|
|
14.1 |
|
|
14.2 |
|
|
19.1 |
|
|
21.1* |
|
|
23.1* |
|
|
31.1* |
|
|
31.2* |
|
|
32.1* |
|
|
32.2* |
|
|
97.1 |
|
|
101.INS* |
|
Inline XBRL Instance Document–the instance document does not appear in the Interactive Data File as its XBRL tags are embedded within the Inline XBRL document. |
101.SCH* |
|
Inline XBRL Taxonomy Extension Schema With Embedded Linkbase Documents. |
104 |
|
Cover page formatted as Inline XBRL and contained in Exhibit 101. |
* Filed herewith
ITEM 16. FORM 10-K SUMMARY
The Registrant has elected not to provide summary information.
67
SIGNATURES
Pursuant to the requirements of section 13 or 15(d) of the Securities Exchange Act of 1934, the Registrant has duly caused this report to be signed on its behalf by the undersigned, thereunto duly authorized.
|
Palmer Square Capital BDC Inc. |
|
|
|
|
Dated: February 27, 2025 |
By: |
/s/ Christopher D. Long |
|
|
Christopher D. Long |
|
|
Chief Executive Officer |
|
|
(Principal Executive Officer) |
Pursuant to the requirements of the Securities Exchange Act of 1934, this report has been signed below by the following persons on behalf of the registrant and in the capacities and on the dates indicated.
Signature |
|
Title |
|
Date |
|
|
|
|
|
/s/ Christopher D. Long |
|
Chief Executive Officer and Chairman of the Board of Directors |
|
February 27, 2025 |
Christopher D. Long |
|
(Principal Executive Officer) |
|
|
|
|
|
|
|
/s/ Jeffrey D. Fox |
|
Chief Financial Officer and Director |
|
February 27, 2025 |
Jeffrey D. Fox |
|
(Principal Financial and Accounting Officer) |
|
|
|
|
|
|
|
/s/ Megan L. Webber |
|
Director |
|
February 27, 2025 |
Megan L. Webber |
|
|
|
|
|
|
|
|
|
/s/ James W. Neville Jr. |
|
Director |
|
February 27, 2025 |
James W. Neville Jr. |
|
|
|
|
|
|
|
|
|
/s/ Christopher C. Nelson |
|
Director |
|
February 27, 2025 |
Christopher C. Nelson |
|
|
|
|
68